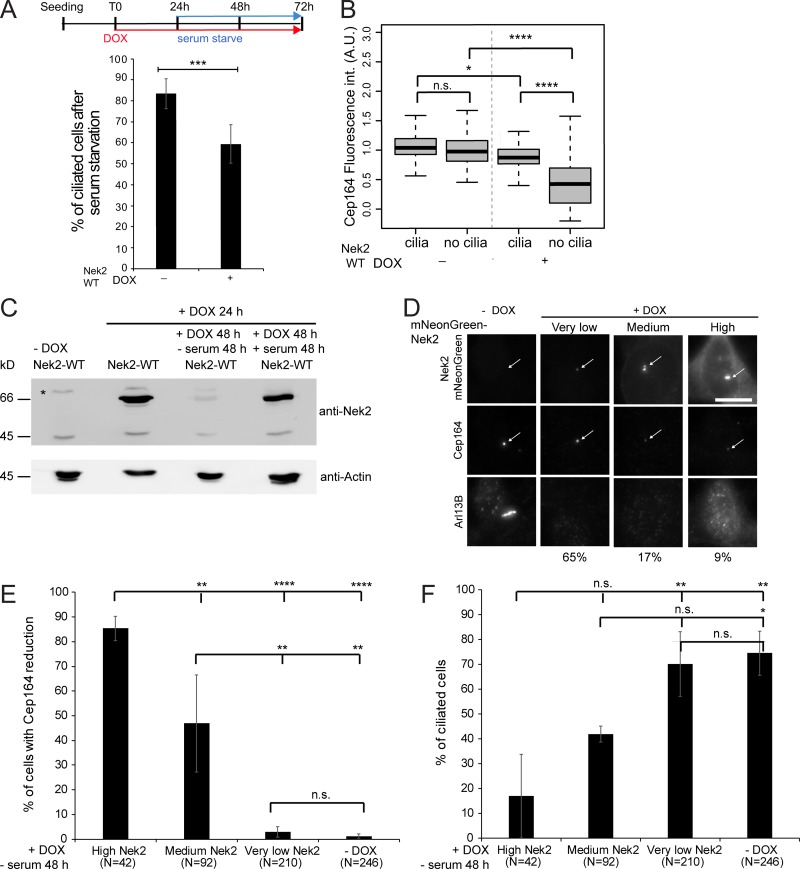
Figure 8.
DA release is implicated in reducing ciliation upon Nek2 overexpression. (A) Schematic diagram of the experimental procedure in Fig. 8, A–F (each block represents 24 h). Cells were fixed for immunofluorescence and stained for Arl13B (cilia marker), Cep164, and γ-tubulin (basal body markers). The graph shows the percentage of ciliated cells in six independent experiments. Bar graphs represent mean ± SD. n > 250 cells per condition. (B) Quantification of A for Cep164 centrosomal levels in ciliated and nonciliated cells in the presence or absence of DOX. Boxplot shows the data of six independent experiments. Boxes show interquartile range, lines inside the box represent the median, and whiskers show minimum and maximum values excluding outliers. n = 195 cells per condition. int., intensity. (C) Representative Western blot shows mNeonGreen-Nek2A levels detected with anti-Nek2 antibodies upon mNeonGreen-Nek2A (Nek2-WT) overexpression by DOX and serum starvation as indicated. Actin serves as a loading control. Asterisk indicates an unspecific band. The lower Nek2 band (∼45 kD) is the size of endogenous Nek2, and the upper band corresponds to mNeonGreen-Nek2A. (D) Correlative analysis of Nek2 and Cep164 centrosomal levels. Cells were treated as in A and analyzed by immunofluorescence using Cep164 and Arl13B antibodies. mNeonGreen-Nek2A was visualized by direct fluorescence. Cells were categorized as carrying low, medium, and high centrosomal Nek2A levels upon DOX induction. The arrows mark centrosomal mNeonGreen-Nek2A and Cep164. Scale bar, 20 µm. Percentages below the pictures indicate the proportion of cells found for each classification. (E and F) Quantification of D showing the percentage of cells with reduced centrosomal Cep164 levels (E) and ciliated cells (F) in each indicated category in four independent experiments. Bar graphs represent mean ± SD. The number of inspected cells (N) in E and F is indicated below the graphs. A.U., arbitrary units; n.s., not significant. Significance probability values are: n.s., P > 0.05; *, P ≤ 0.05; **, P ≤ 0.01; ***, P ≤ 0.001; ****, P ≤ 0.0001.

