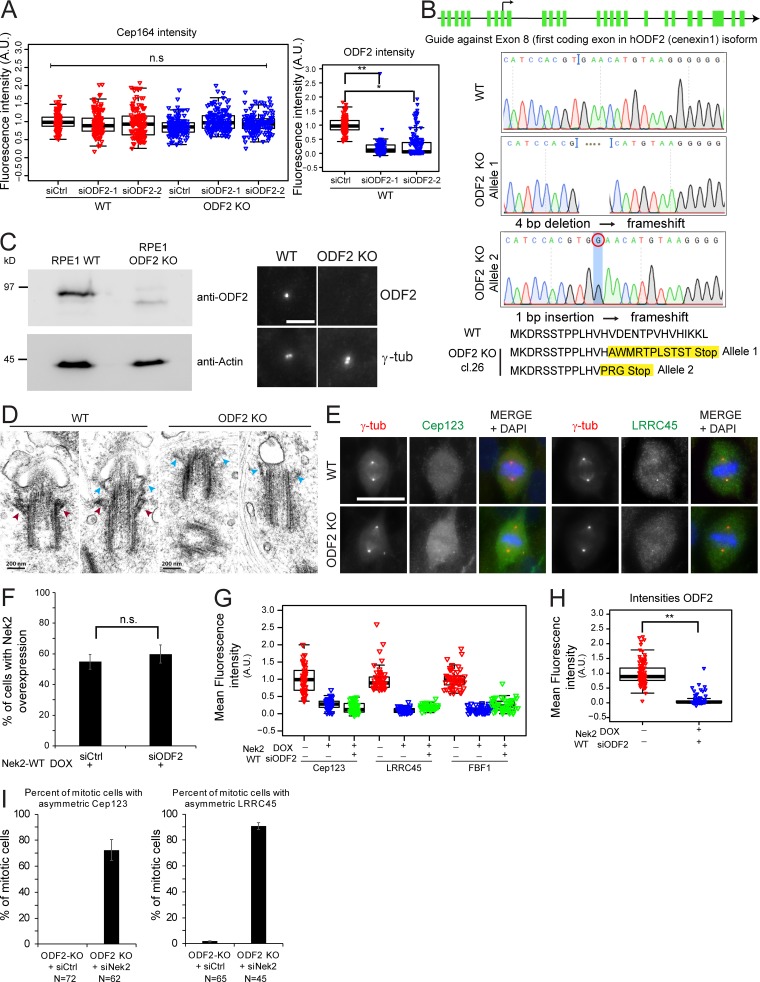
Figure S4.
DAs regulation in ODF2 KO cells. (A) Box/dot plots show the quantification of Cep164 and ODF2 intensity at centrosomes in RPE1 WT and ODF2 KO cells using two different ODF2 siRNAs as indicated. Dots represent individual cells, boxes show interquartile range, lines inside the box represent the median, and whiskers show minimum and maximum values excluding outliers. n = 150 cells were analyzed per condition for both stainings. (B) Schematic representation of the ODF2 KO strategy using CRISPR/Cas9 targeting exon 8 the first coding exon for the hODF2 (cenexin1) isoform. The line represents the region of chromosome 9 that carry the ODF2 gene. The green bars represent the exons of ODF2. Sequencing results and the resulting frameshift mutations, which led to premature stop of translation, are shown. Cl.26, clone 26. (C) Western blot and immunofluorescence analysis of RPE1 WT and ODF2 KO cells using anti-ODF2 antibodies. Actin was used as a loading control, and γ-tubulin (γ-tub) was used as a centrosome marker. Scale bar, 5 µm. (D) Electron micrographs show longitudinal serial sections of RPE1 WT and RPE1 ODF2 KO cells. Cells were serum starved for 48 h before fixation for transmission electron microscopy analysis to induce ciliogenesis and facilitate the recognition of the M-centriole via the associated ciliary membrane. Red arrowheads indicate SDAs, and blue arrowheads show DAs. Early stages of ciliogenesis are shown. Approximately 10 centrioles were analyzed per cell line. Scale bar, 200 nm. (E) Representative images of fixed mitotic RPE1 WT and RPE1 ODF2 KO cells stained using the indicated antibodies for DAs. γ-tubulin (γ-tub; red) and DAPI (blue) serve as markers for centrosomes and nuclei, respectively. Scale bar, 20 µm. (F) Levels of Nek2A overexpression upon ODF2 depletion. Quantification of RPE1 mNeonGreen-Nek2A–positive cells (overexpressed by DOX addition as described in Fig. 7 E) upon control (siCtrl) or ODF2 siRNA treatment. Bar graphs represent mean ± SD. n = 229 (siCtrl) and n = 265 (siODF2) in two independent experiments. (G) Effect of Nek2A overexpression in the presence or absence of ODF2. RPE1 mNeonGreen-Nek2A cells were treated with solvent (− DOX) or DOX (+ DOX) to induced Nek2A overexpression as well as control (− siODF2) or ODF2 siRNA (+ siODF2) to deplete ODF2. Box/dot plots show quantification of the indicated appendage intensities at centrosomes. One representative experiment is shown. Dots represent individual cells, boxes show interquartile range, lines inside the box represent the median, and whiskers show minimum and maximum values excluding outliers. n = 50 cells per condition. Cep164 levels are shown in Fig. 7 E. (H) Box/dot plots show the quantification of ODF2 intensity at centrosomes for G and Fig. 7 E. n = 98 cells per condition. (I) RPE1 ODF2 KO cells were stained with Cep123 or LRRC45 antibodies upon control (Ctrl) and Nek2 siRNA treatment. γ-tubulin and DAPI serve as markers for centrosomes and nuclei, respectively. The graphs show the percentage of mitotic cells in which Cep123 or LRRC45 associates preferentially at one centrosome. Bar graphs represent mean ± SD. Please see Fig. 6 E for quantifications of Cep164 from the same experiment. A.U., arbitrary units; n.s., not significant. Significance probability values are: n.s., P > 0.05; *, P ≤ 0.05; **, P ≤ 0.01; ***, P ≤ 0.001; ****, P ≤ 0.0001.

