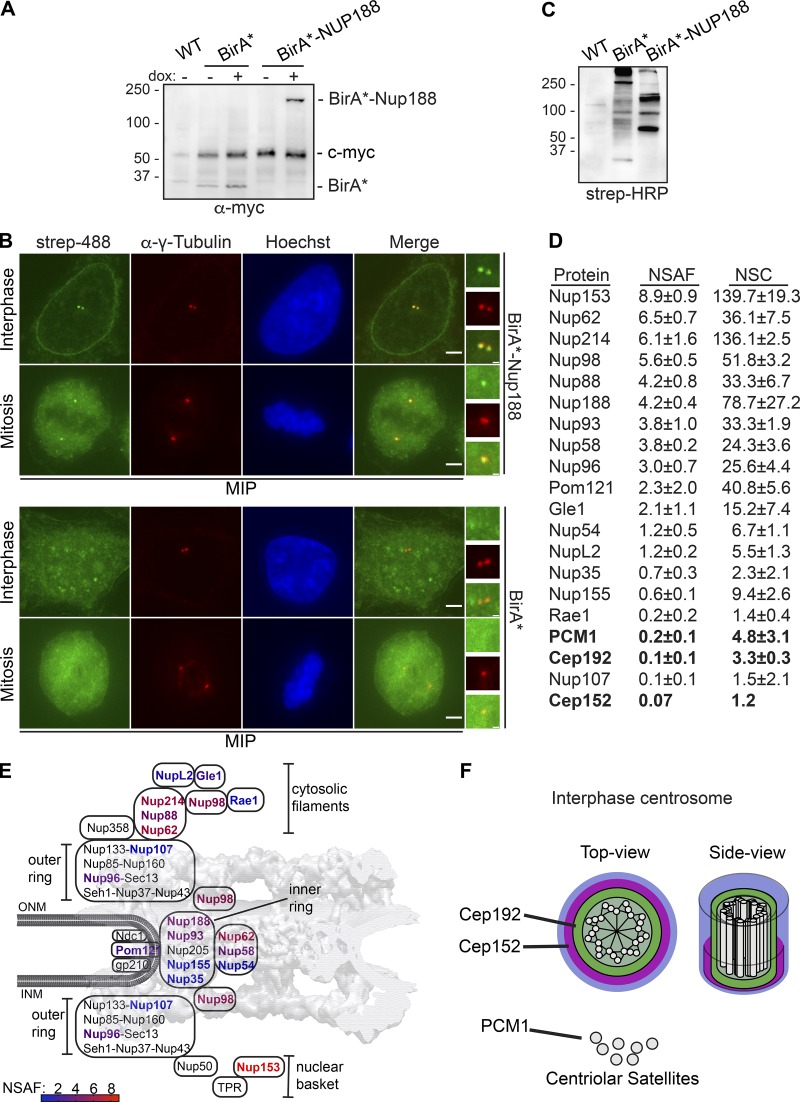
Figure 5.
Proximity-labeling predicts physical interactions between Nup188 and PCM. (A) BirA* and BirA*-Nup188 are stably and inducibly expressed at similar levels. Western blots of whole cell extracts from BirA*- and BirA*-Nup188–expressing cell lines. Both BirA* and BirA*-Nup188 are under the control of a dox-inducible promoter and produced with a myc epitope to allow detection by Western blot. Note that endogenous c-myc is also detected in all lanes and serves as a total protein load reference. Numbers at left are positions of molecular weight standards (in kD); − and + denote absence or presence of dox, respectively. (B) Centrosomes and the nuclear envelope are specifically biotinylated in cell lines expressing BirA*-Nup188. Maximum-intensity projections (MIPs) of a Z-series of fluorescence micrographs of BirA*-Nup188 (top panels) and BirA* alone (bottom panels) expressing cells. DNA is stained with Hoechst (blue) to help identify metaphase cells and visualize the nucleus. Biotinylated proteins are labeled with streptavidin (strep) coupled to Alexa Fluor 488 (green). Centrosomes are labeled with α-γ-Tubulin (red). Scale bar is 5 µm. Boxed regions of centrosomes in green, red, and merge are magnified at right. Scale bar is 0.5 µm. (C) Total protein from HeLa cells (WT) and those producing BirA* and BirA*-Nup188 were separated by SDS-PAGE; biotinylated proteins detected by strep coupled to HRP. Numbers at left are positions of molecular weight standards (in kD). (D) Table of biotinylated proteins identified in BirA*-Nup188–expressing cells with NSAF and normalized spectral count (NSC) values (mean ± SD) from three independent replicates. See Table S1 for all proteins identified. (E) Schematic of the relative location of nups within a diagram of the NPC superimposed on a cryo-EM map of the NPC structure (von Appen et al., 2015). Biotinylated nups are color coded based on the heat map scale of NSAF values indicated at bottom. INM and ONM are inner and outer nuclear membrane, respectively. (F) Approximate scale diagram of centrosome showing position of Cep192 and also PCM1 as a component of centriolar satellites.

