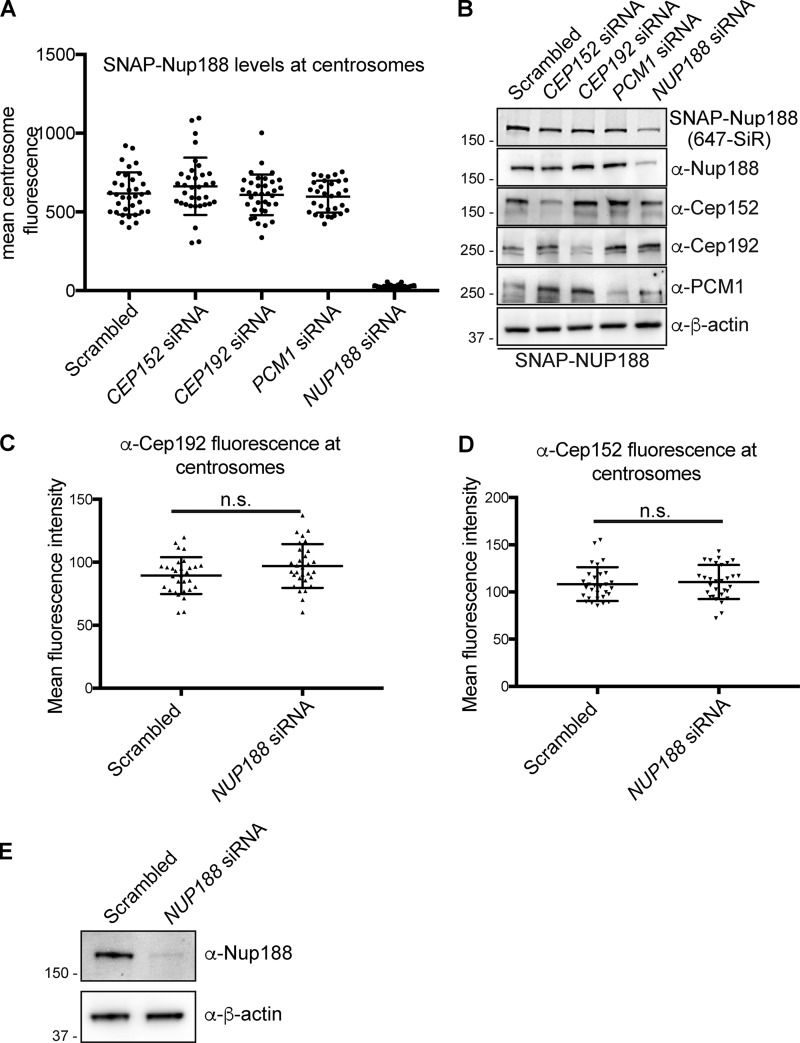
Figure S3.
Centrosome associations of Nup188 and PCM proteins are independent of each other. (A) Plot of the mean fluorescence at centrosomes of SNAP-Nup188 labeled with 647-SiR dye in cells treated with indicated siRNAs. More than 30 cells were quantified with mean ± SD shown. (B) Western blots (or fluorescence image/top panel) of total protein from SNAP-NUP188–expressing HeLa cell extracts prepared from cells treated with the indicated siRNAs. α-β-Actin is a protein load reference. Numbers at left are positions of molecular weight standards (in kilodaltons). (C). Representative plot of α-Cep192 mean fluorescence ± SD at centrosomes (n > 30). (D) Representative plot of α-Cep152 mean fluorescence ± SD at centrosomes (n > 30). (E) Western blots of total protein from HeLa cell extracts prepared from cells treated with NUP188 siRNA. α-β-Actin is a protein load reference. n.s., not significant as calculated from two-way ANOVA. Numbers at left are positions of molecular weight standards (in kilodaltons).

