Table 2.
Modification of carboxylic acid moiety of 12
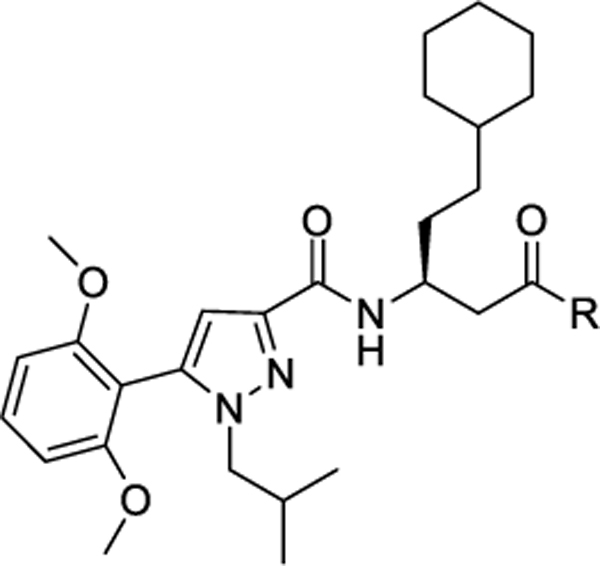 |
| Compd. | R | APJ Calcium EC50* μM±SEM (%Emax) |
APJ cAMP EC50* μM±SEM (%Emax) |
APJ β-arrestin EC50* μM±SEM (%Emax) |
APJ Binding Ki* (μM±SEM) |
AT1 Calcium EC50* (μM±SEM) |
|---|---|---|---|---|---|---|
| 17. | -NH2 | 5.75 ± 1.1 (94) | >10 | 7.24 ± 0.9 (133) | ND* | ND |
| 18. | 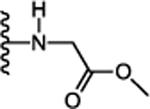 |
0.288 ± 0.03 (92) | 0.684 ± 0.1 (105) | 0.280 ± 0.001 (89) | ND | ND |
| 19. | 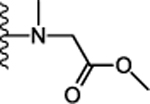 |
0.237 ± 0.04 (91) | 1.85 ± 0.2 (106) | 0.453 ± 0.014 (87) | ND | ND |
| 20. | 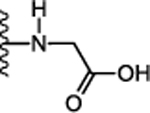 |
1.85 ± 0.5 (77) | 4.82 ± 1.1 (129) | 8.87 ± 2.7 (87) | ND | ND |
| 21. | 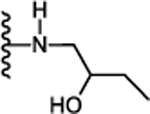 |
0.046 ± 0.008 (88) | 0.118 ± 0.02 (104) | 0.113 ± 0.02 (89) | 0.036 ± 0.006 | >10 |
| 22. | 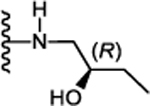 |
0.069 ± 0.02 (139) | 0.157 ± 0.08 (104) | 0.114 ± 0.005 (90) | 0.038 ± 0.01 | >10 |
| 23. | 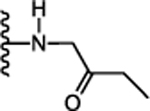 |
0.144 ± 0.03 (102) | 0.246 ± 0.02 (106) | 0.182 ± 0.045 (87) | 0.172 ± 0.1 | >10 |
| 24. |  |
1.70 ± 0.04 (94) | 3.17 ± 0.8 (134) | 0.313 ± 0.04 (81) | ND | ND |
| 25. |  |
0.081 ± 0.02 (91) | 0.283 ± 0.08 (97) | 0.144 ± 0.008 (90) | 0.054 ± 0.01 | >10 |
EC50 and Ki values are averages of multiple experiments performed in duplicate unless otherwise stated ± standard error of the mean.
ND = Not Done
