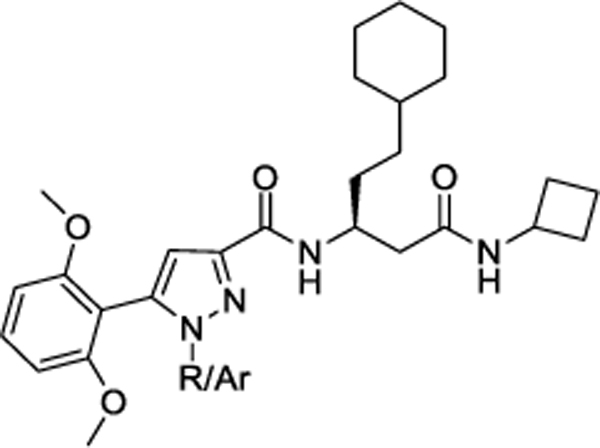
Table 4.
Modification at N1 position of pyrazole core
 |
| Compd. | R | APJ Calcium EC50* μM±SEM (%Emax) |
APJ cAMP EC50* μM±SEM (%Emax) |
APJ β-arrestin EC50* μM±SEM (%Emax) |
APJ Binding Ki* μM±SEM), (%Emax) |
AT1 Calcium EC50* (μM) |
|---|---|---|---|---|---|---|
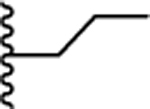
| 35. |  |
0.425 ± 0.06 (45) | 0.344 ± 0.004 (91) | 0.422 ± 0.008 (75) | ND* | ND |
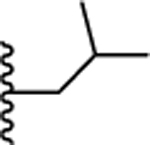
| 36. |  |
0.049 ± 0.004 (91) | 0.107 ± 0.046 (110) | 0.078 ± 0.02 (77) | 0.060 ± 0.03 | >10 |
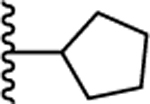
| 25. |  |
0.081 ± 0.025 (91) | 0.282 ± 0.08 (97) | 0.144 ± 0.008 (90) | 0.054 ± 0.01 | >10 |
| 37. |  |
0.070 ± 0.009 (94) | 0.097 ± 0.032 (106) | 0.063 ± 0.004 (89) | 0.059 ± 0.02 | >10 |
| 38. |  |
0.101 ± 0.001 (87) | 0.151 ± 0.04 (101) | 0.092 ± 0.007 (78) | 0.147 ± 0.06 | >10 |
EC50 and Ki values are averages of multiple experiments performed in duplicate unless otherwise stated ± standard error of the mean.
ND = Not Done
