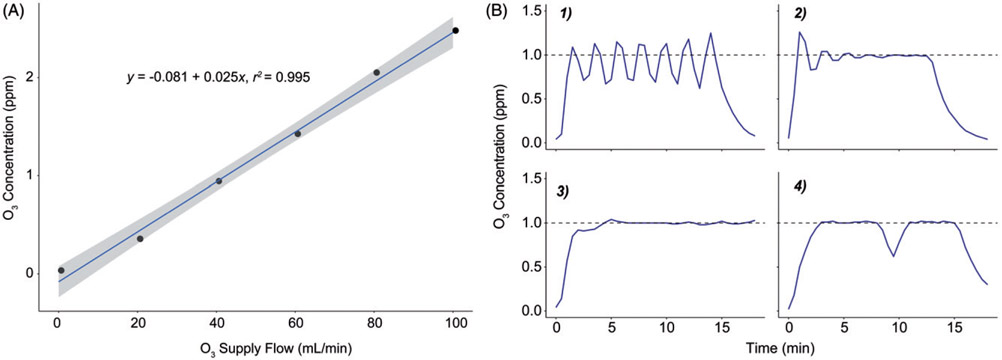
Figure 3.
Initial manual testing and abridged PID control tuning. (A) Linear correlation between ozone supply MFC flow rate setting and resulting chamber ozone concentration. These data were used to determine the range and estimate the capacity of the generation system. The shaded area represents a 95% confidence interval for a linear regression model (see Equation). (B) Panels illustrating the progression of the Edisonian process used to determine optimal gain settings for the DASYLab® PID control module. Panel 1: steady oscillations induced by increasing the proportional gain. Panel 2: improved settling time and offset resulting from increasing the integral and derivative gains. Panel 3: an appropriately damped system with optimal PID gain settings. Panel 4: system response to turning off the ozone generator for 1 min. Dashed line indicates the desired concentration setpoint of 1 ppm during initial testing.

