Fig. 1.
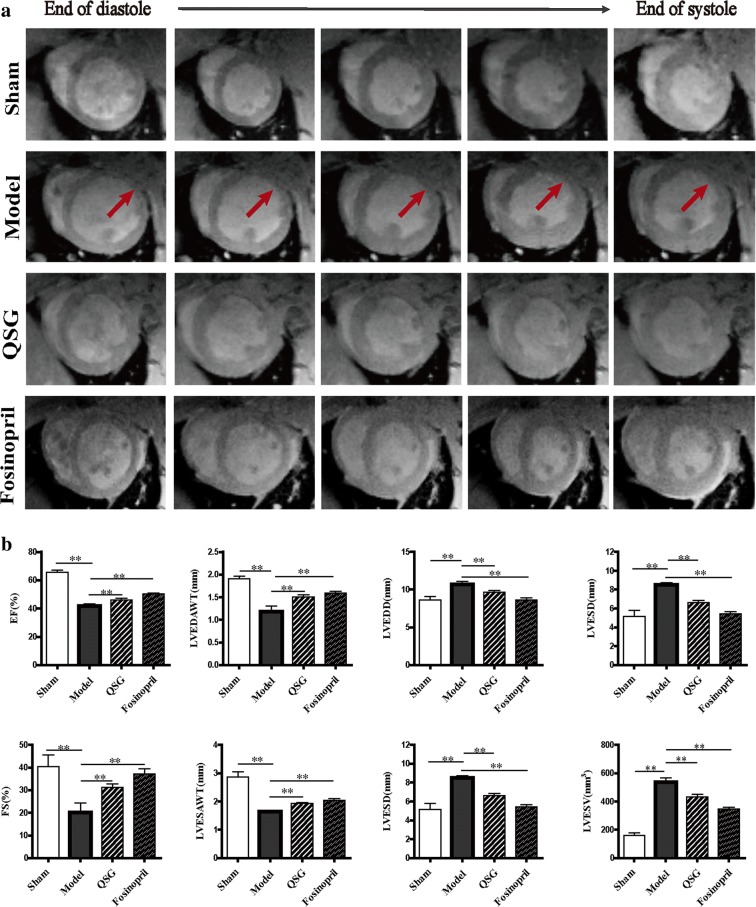
Effects of QSG on cardiac structure and function by MRI in HF rats after AMI. a Representative MR images of rat hearts at the slice of papillary muscle in short-axis view in the four groups. From left to right was the process from the end of diastole to the end of systole. The anterior wall of the left ventricle in the model group was thinner (red arrow) while ventricular cavity was larger in the model group. After drug treatment, ventricular remodeling was attenuated in QSG and fosinopril group. b Bar graphs of LV parameters in the four groups. Rats in the model group underwent significant drops in EF, FS, LVEDAWT and LVESAWT and increases in LVEDD, LVESD, LVEDV, LVESV compared to the sham group. LVEDD, LVESD, LVEDV and LVESV decreased observably, meanwhile LVEDAWT, LVESAWT, FS and EF increased obviously in QSG and fosinopril group compared with the model group. n = 6 per group. Values are mean ± SE. Asterisks indicates significant differences. **P < 0.01

