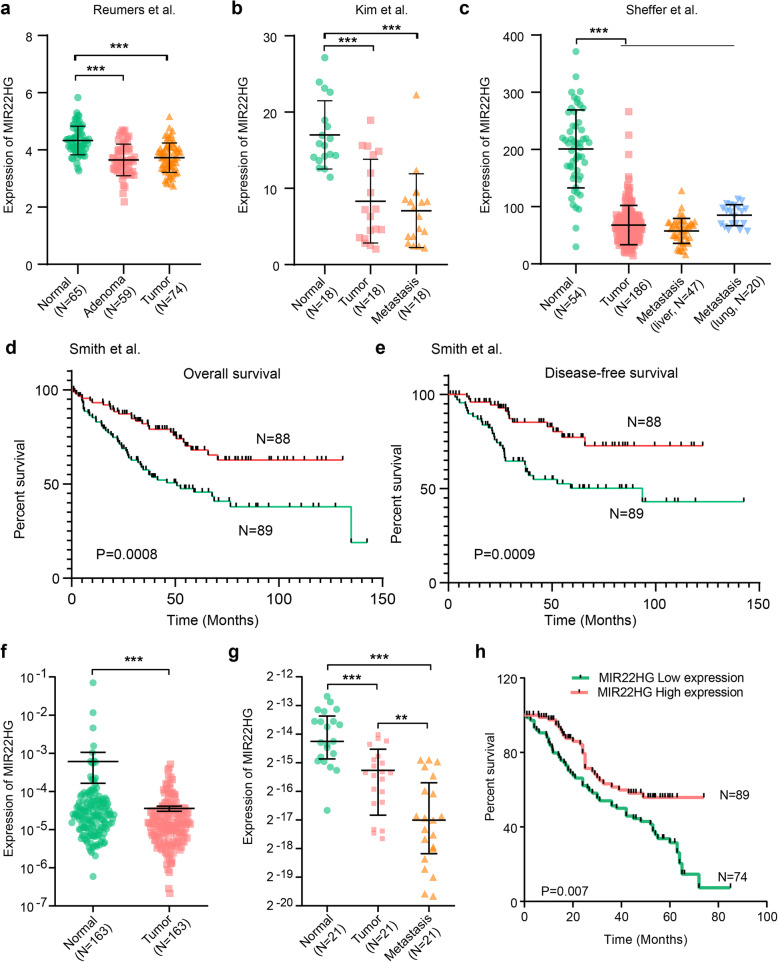
Fig. 2.
Validation of MIR22HG expression in independent datasets. a-c, The distribution of MIR22HG expression in three independent datasets. d-e, Kaplan-Meier overall survival curves (d) and disease-free survival curves (e) are presented. All patients were divided into two groups based on the expression of MIR22HG. Red, high expression of MIR22HG and green, low expression of MIR22HG. f, The expression of MIR22HG in 163 normal and tumor samples. g, The expression of MIR22HG in 21 normal, tumor and metastasis Chinese samples. h, Kaplan-Meier overall survival of Chinese CRC patients based on expression of MIR22HG

