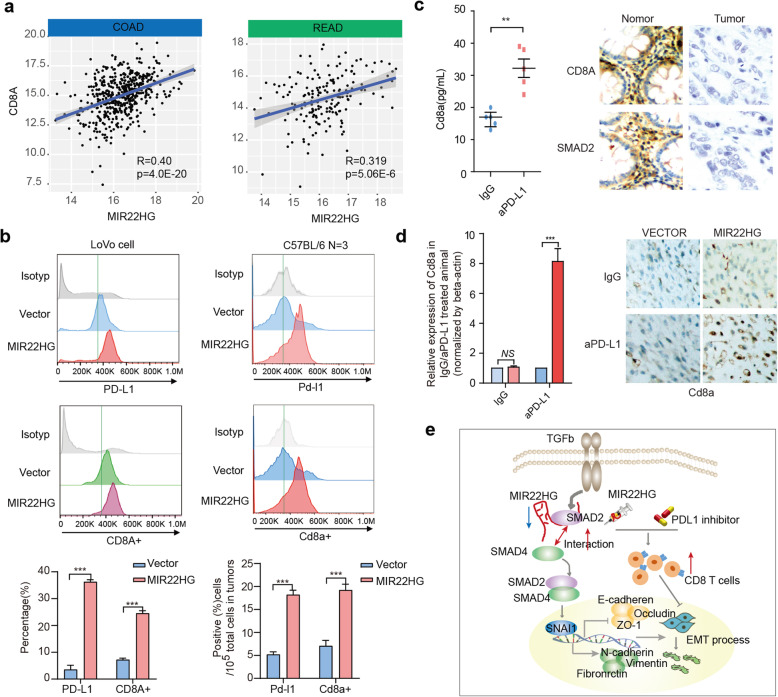
Fig. 8.
MIR22HG increases the CD8 T cells in CRC. a, Scatter plots showing the correlation between CD8A expression and MIR22HG expression. b, Cell-surface expression of PD-L1 and CD8A with overexpressing MIR22HG. Left panels for human cell line and right panels for mouse. c, Relative expression of Cd8a in mice treated with aPD-L1. The right panels showing the IHC staining of CD8A and SMAD2 in tumor and normal tissues of CRC. d, Left panel showing the relative expression of Cd8a in IgG/aPD-L1 + MIR22HG treated mice. Right panel showing the IHC staining of Cd8a. e, The mechanistic scheme of lncRNA MIR22HG in CRC

