Fig. 1.
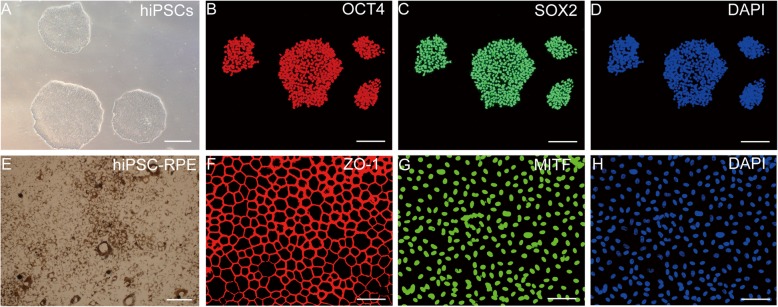
Characterization of hiPSCs and hiPSC-RPE. a Brightfield images of hiPSCs exhibiting typical colonies morphology. b, c hiPSCs expression of pluripotency markers OCT4 and SOX2. d, h Cell nucleus staining with DAPI. e Brightfield images of hiPSC-RPE cells display melanin pigmentation and polygonal morphology. f, g hiPSCs-RPE expression of typical RPE markers, cell boundaries when stained with ZO-1, and nuclear staining with MITF. Scale bar 200 μm (a, e) and 100 μm (b, c, d, f, g, h)

