Figure 3.

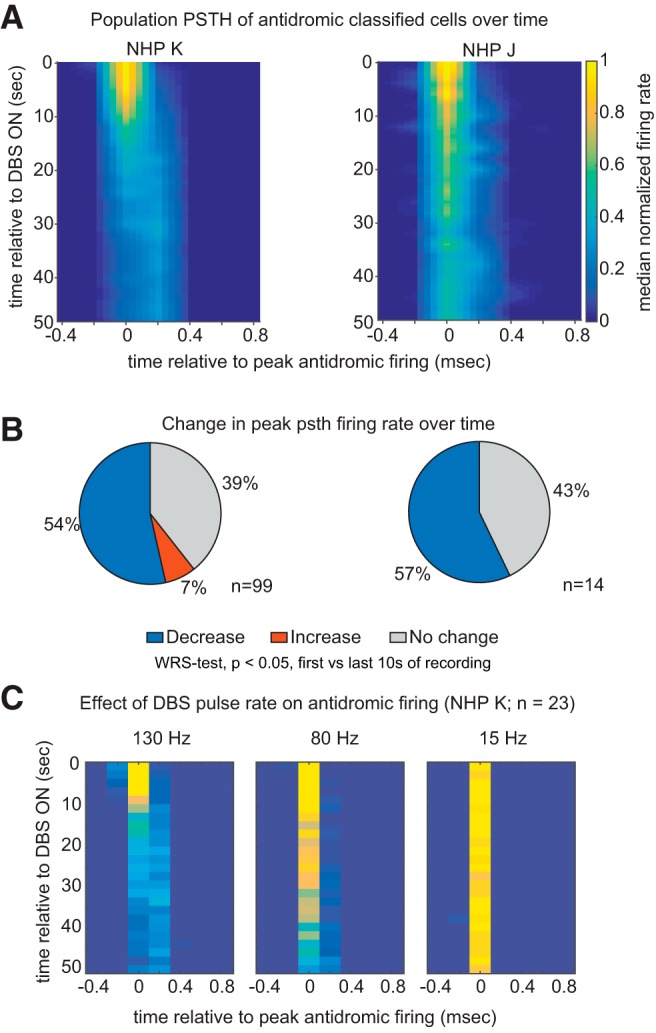
Strength of antidromic firing in M1 diminishes over time. A, Heat map illustrating the time course of the population PSTH of M1 cells that were antidromically activated during the first 50 s of STN DBS for both subjects. Before averaging, the PSTH of each cell was aligned to the time bin in the PSTH where firing was maximal, and firing rate normalized to the firing rate calculated over the first three time bins. Zero on the x-axis represents the time point of peak antidromic firing. PSTH were calculated in 2 s bins and for visualization a 5-point linear interpolation both x and y axes was performed. B, The percentage of cells with significant change in their peak PSTH firing rate [first 10 s vs the last 10 s, Wilcoxon rank sum (WRS) test, p < 0.05]. C, Time course of the population PSTH of cells whose responses to 15 and 80 Hz stimulation were tested in addition to 130 Hz.
