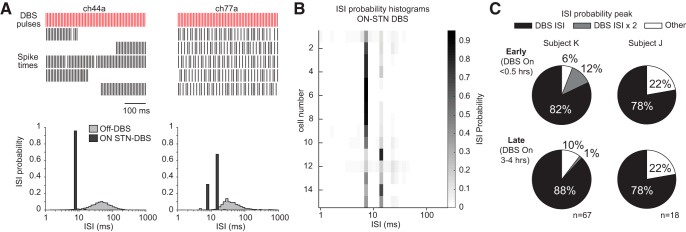
Figure 5.
Interspike interval (ISI) probability histograms illustrate that antidromic-classified cells had highly regular discharge patterns during DBS. A, Spike occurrences during STN DBS in two M1 cells from Subject K are shown in the top (2.5 s duration segment shown, each row = 0.5 s). Corresponding ISI probability histograms from the entire recording block are shown in the bottom, with Off-DBS ISI histograms shown for comparison. Prominent peaks corresponding to one and two times the DBS stimulation interstimulus period (∼7.7 ms) are evident. B, ISI probability histograms from 15 simultaneously recorded cells identified as antidromic (Subject K) displayed as a heat map. C, Proportion of antidromic-classified cells in subacute DBS sessions with ISI probability peaks at one or two times the DBS ISI (or other) based on recordings at early (<0.5 h on-DBS) and late (3–4 h on-DBS) in the on-DBS recording period.

