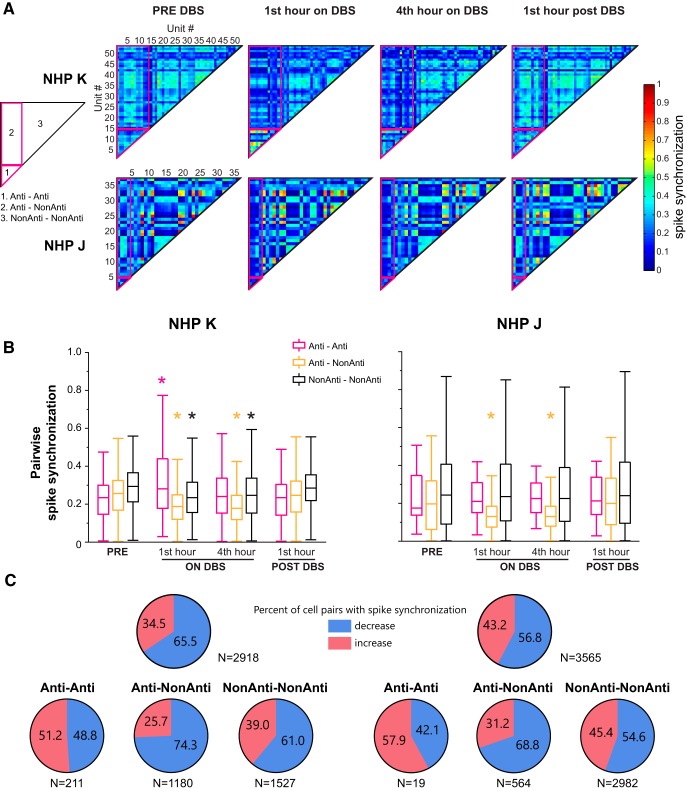
Figure 7.
Pairwise spike synchronization of simultaneously recorded unit activities pre, during and post-therapeutic STN DBS in both NHPs. A, Averaged matrix illustration of the pattern of cell–cell synchronization changes with STN DBS from the first stimulation day in each animal. Matrices were generated based on the synchronization score calculated for each pair of cells. Fourteen (of 54) and four (of 30) antidromic classified neurons were identified in Subjects K and J, respectively, in these examples. Different pairs including antidromic to antidromic (Anti–Anti), antidromic to non-antidromic (Anti–NonAnti), non-antidromic to non-antidromic (NonAnti–NonAnti) neurons are labeled as shown in the left matrix pattern. B, Pairwise spike synchronization from all the stimulation days that had awake rest data in the PRE-DBS condition (2 for Subject K and 5 for Subject J) for different groups (Anti–Anti, Anti–NonAnti and NonAnti–NonAnti) are shown. Anti–NonAnti pairwise spike synchronization was reduced by STN DBS in both subjects, whereas NonAnti–NonAnti spike synchronization was only reduced in Subject K. Anti-Anti spike synchronization did not change except for an increase at the first hour on STN DBS in Subject K. Wilcoxon test followed by Steel's test with control = PRE. *p < 0.05. C, Proportion of cell pairs with increased or decreased cell–cell spike synchronization scores, comparing pre-DBS period to fourth hour on-DBS, in all cell pairs (top) and in different groups (bottom).

