Figure 8.
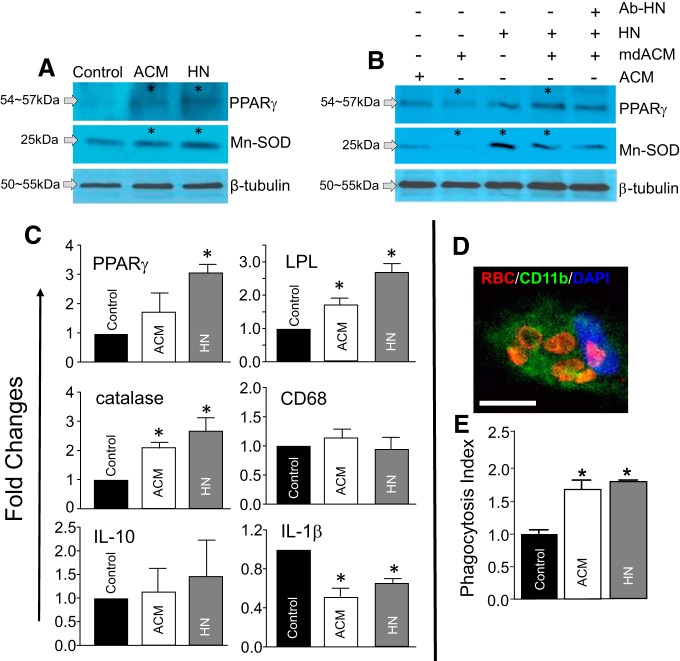
HN or ACM upregulates PPARγ/Mn-SOD and other prototypic PPARγ target genes in microglia, and enhances microglial phagocytic activity in an in vitro hematoma clearance model. A, Western blots determine microglial induction of PPARγ and Mn-SOD at 24 h after exposure to ACM or HN (20 μm). The significance of induction was as follows: CON versus ACM in PPARγ, n = 3, two-tailed unpaired t test, *p = 0.0310, t values (t = 5.548). CON versus HN in PPARγ, n = 4, two-tailed unpaired t test, *p = 0.0337, t values (t = 2.741). CON versus ACM in Mn-SOD, n = 4, two-tailed unpaired t test, *p = 0.0289, t values (t = 2.857). CON versus HN in Mn-SOD, n = 4, two-tailed unpaired t test, *p = 0.0209, t values (t = 3.109). B, Mn-SOD and PPARγ protein levels in the microglia. ACM after removing Mt (Mt depleted ACM; mdACM, by filtration with 0.22 μm filter alone) or in combination with HN neutralizing antibody (Ab-HNr, 100 ng) was added to cultured microglia and incubated for 24 h, as above. The significant changes in PPARγ; n = 3 or 4. One-way ANOVA/Kruskal–Wallis test: ACM versus mdACM treatment, *p = 0.0486, mean rank difference (7.0) and for mdACM versus mdACM + HN, *p = 0.0011, mean rank difference (−12.5). The significant changes in Mn-SOD; n = 3–5. One-way ANOVA/Kruskal–Wallis test: ACM versus mdACM, *p = 0.0173, mean rank difference (8.4); mdACM versus HN, *p = 0.0210, mean rank difference (−9.4); and mdACM versus mdACM + HN, *p = 0.0084, mean rank difference (−10.73). C, Gene expression profile by RT-PCR (SYBR real-time analysis) in microglia treated with ACM or HN (20 μm) for 24 h. Data are mean ± SEM; n = 3. One-way ANOVA/Fisher's LSD test: PPARγ, *p = 0.0131, t values (t = 3.484) at control versus HN; LPL, *p = 0.0386, t values (t = 2.638) at control versus ACM, *p = 0.0007, t values (t = 6.355) at control versus HN; catalase, *p = 0.0353, t values (t = 2.705) at control versus ACM, *p = 0.0063, t values (t = 4.102) at control versus HN; IL-1β, *p = 0.0018, t values (t = 6.057) at control versus ACM, *p = 0.0131, t values (t = 3.484) at control versus HN. D, E, Phagocytosis assay. Rat primary microglia were treated with ACM, HN (20 μm), or vehicle (control) for 24 h. Rat RBCs (1 × 10⁶ RBCs/well) were added as a phagocytic target. After 2 h, the cells were fixed and processed for immunostaining to determine the number of engulfed RBCs. D, Representative confocal image of microglia/CD11b+ (green) containing engulfed RBCs (red). Scale bar, 10 μm. E, Index of phagocytosis illustrating increased levels with ACM or HN treatment. Data are mean ± SEM; n = 3 or 4 per group. One-way ANOVA/Bonferroni's test: *p = 0.0013, CON versus ACM, t values (t = 6.227); *p = 0.0002, CON versus HN, t values (t = 8.228). CON, Control.

