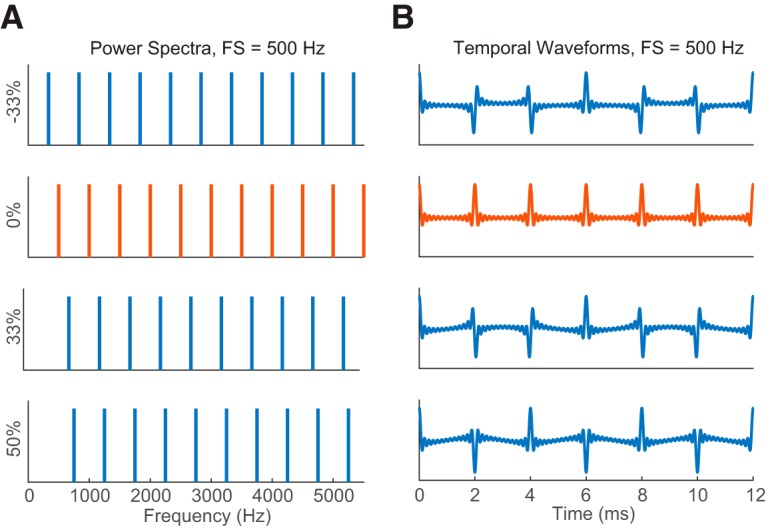
Figure 1.

HCTs and IHCTs. A, Power spectra of HCT (0% shift, orange) and IHCTs (non-zero shift, blue) with the same FS = 500 Hz. Y labels indicate amounts of frequency shift from the HCT as percentages of FS. For the harmonic tone, FS is equivalent to F0. B, Temporal waveforms of the corresponding complex tones in A.
