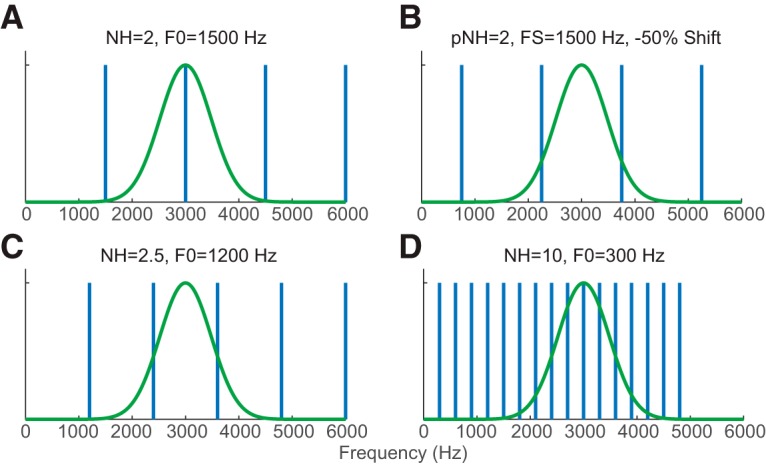
Figure 2.

Schematics for testing rate-place coding in a hypothetical neuron with CF = 3000 Hz (green curves). Vertical bars represent power spectra of the corresponding complex tone. A, NH = 2 (F0 = 1500 Hz), the second harmonic of the corresponding HCT coincides with the neuron's CF. B, For an IHCT with the same FS as in A but −50% shift (750 Hz to lower frequency), the neuron's CF is between two adjacent components. C, NH = 2.5 (F0 = 1200 Hz), CF between two adjacent harmonics. D, NH = 10 (F0 = 300 Hz), the neuron's auditory filter encompasses many harmonics.
