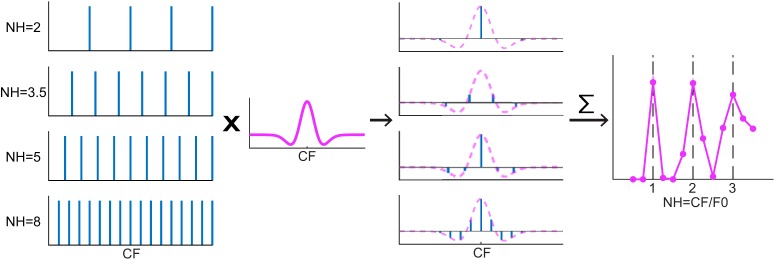
Figure 3.
DoG spectral weighting model diagram. Column 1: Power spectra of HCTs at different NHs. Column 2: A DoG weighting functions centered at the neuron's CF. Column 3: Weighted power spectra by multiplying the HCT spectra with the weighting function (purple dashed lines). Horizontal lines in each panel indicate 0 amplitude. Column 4: Modeled rate-place profile of the neuron. Each point is obtained by summing the weighted power spectrum in Column 3 of an HCT at the corresponding F0, or equivalently, the convolution of the power spectrum and the weighting function at 0 shift.

