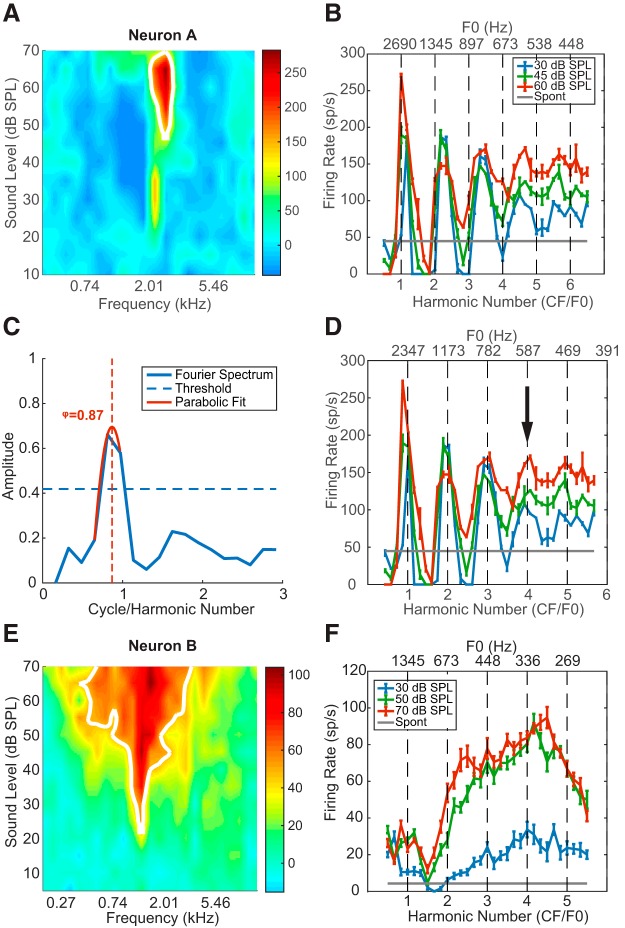
Figure 4.
Example neural responses to HCTs. A, Pure-tone FRA of Neuron A. Colors represent the neuron's FR minus the SR. B, Rate-place profile of Neuron A before the CF adjustment (see Materials and Methods). Error bars indicate ± 1 standard error throughout this report unless specified otherwise. C, Fourier transform of the rate-place profile at 30 dB SPL in B. Horizontal dashed line indicates the 95th percentile of the permutation test. Vertical dashed line indicates the location of the “true” spectrum peak (i.e., the adjustment factor φ) inferred from the parabolic fit (red solid line). D, Rate-place profiles of Neuron A after adjustment. Arrow indicates the neuron's lowest resolved F0. E, Pure-tone FRA of Neuron B, CF = 1.35 kHz. F, Rate-place profile of Neuron B.

