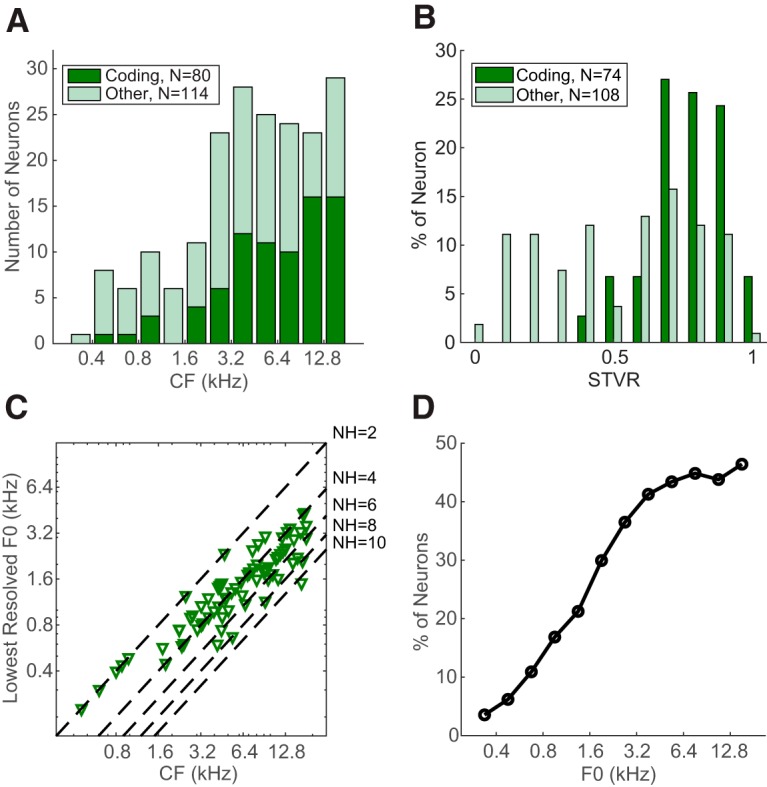
Figure 5.

Frequency distribution of IC rate-place code. A, Distribution of CF for rate-place coding neurons (dark green, bottom) and non–rate-place coding neurons (light green, top). B, Distribution of STVR for coding (dark green) and noncoding (light green) neurons. Neurons tested with less than five total stimulus repetitions were excluded. C, Relationship between the lowest resolved F0 and CF of individual rate-place coding neurons (N = 80). Dashed lines indicate NH = 2, 4, 6, 8, 10. D, Percentage of neurons that were able to resolve F0 in different frequency bands.
