Figure 7.

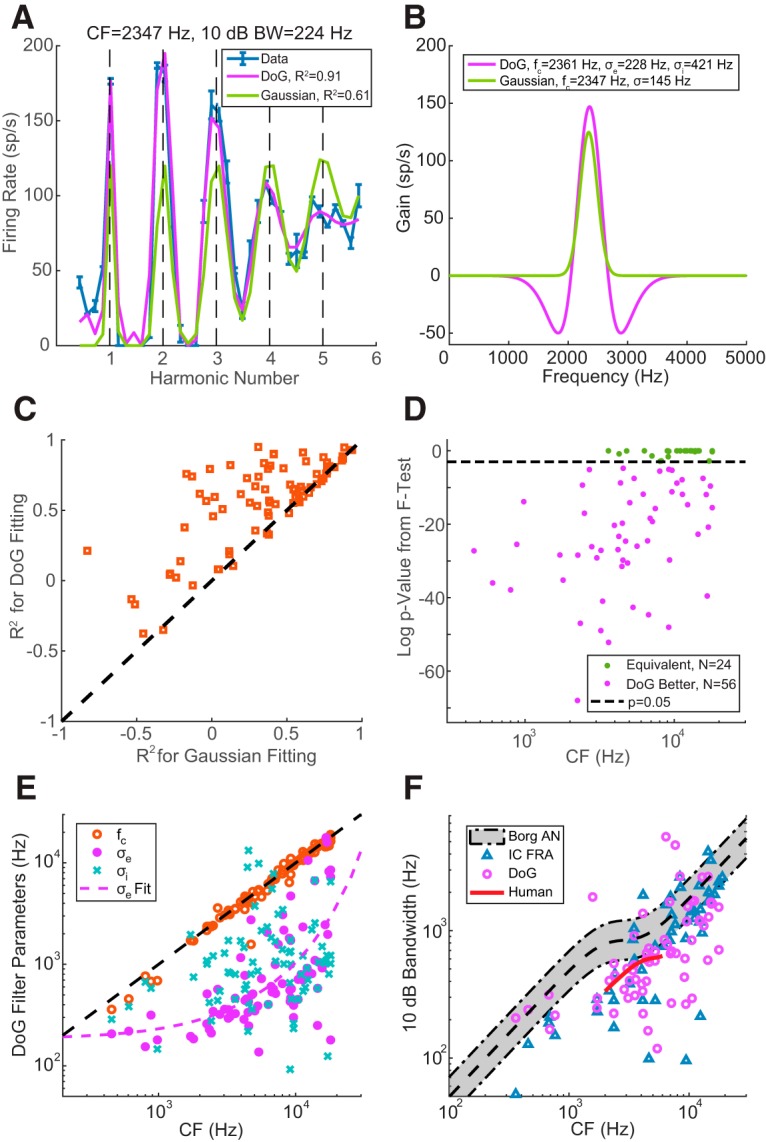
Receptive field model for HCT responses. A, Neural (blue with error bar) and fitted (purple represents DoG model; green represents Gaussian model) rate-place profiles of Neuron A at 30 dB SPL. The 10 dB bandwidth was calculated from FRA at 30 dB SPL. B, Morphology and key parameters of the optimal DoG (purple) and Gaussian (green) weighting functions. C, Comparison of R2 values using the DoG model (y axis) versus the Gaussian model (x axis) for individual neurons (N = 80). D, F test statistics to compare the goodness of fit from the two models. Dashed line indicates p = 0.05, the criterion for statistical significance. E, CF (orange circle), excitatory bandwidth (purple dots), and inhibitory bandwidth (blue “x”) of the optimized DoG model as a function of measured CF in individual neurons. Purple dashed curve indicates exponential fit of the σe versus CF relationship. F, The 10 dB bandwidth estimated from Borg et al. (1988). AN data (gray shaded area, 95% boundary of original data points), FRA of IC neurons showing rate-place coding (N = 53, blue triangle), DoG fitting of IC neurons with rate-place coding (N = 68, purple circle), and human periphery (short red curve) as functions of CF. Black dashed line at the middle of the shaded area indicates a custom fitting of Borg et al. (1988) data.
