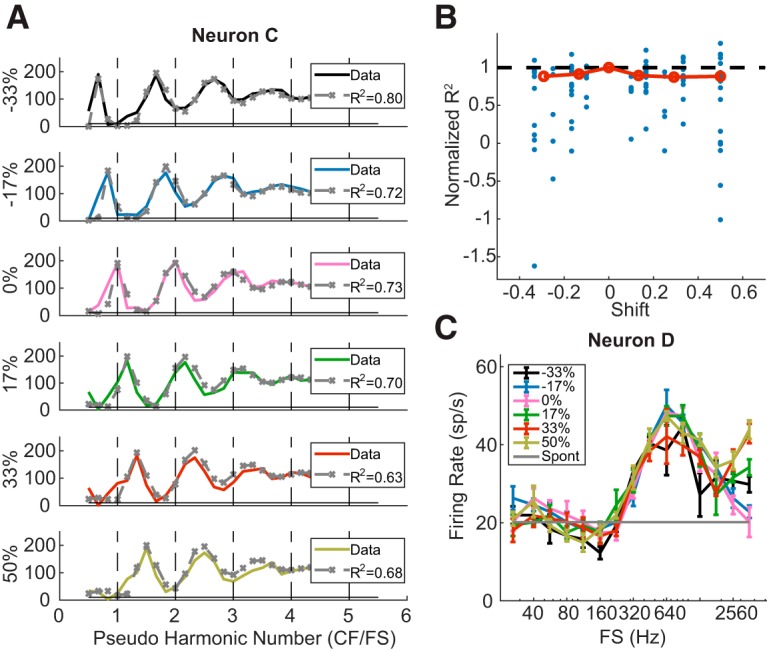
Figure 8.

Neural and model responses to IHCTs. A, Rate-place profiles of Neuron C in response to harmonic and inharmonic tones at 30 dB per component (solid lines). A DoG model was fit to the response to 0% shift and then used to predict responses to non-0 shifts (gray dashed lines with “x”). B, Normalized R2 values of DoG fitting to rate-place profiles at different proportions of frequency shift in individual neurons (blue dots) and their medians (red circles). C, Rate-FS profile of Neuron D at different amounts of frequency shift.
