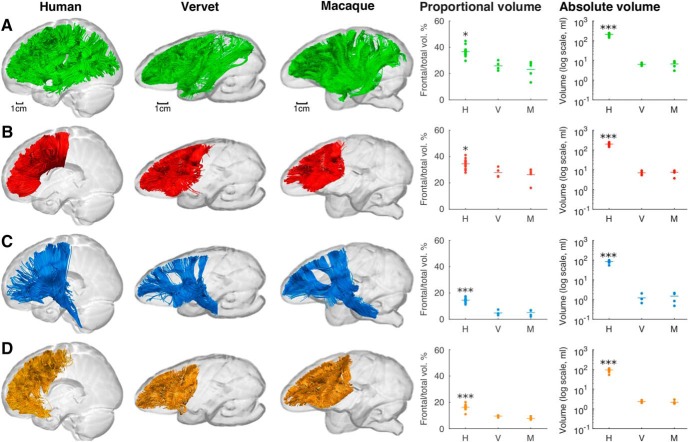
Figure 4.
The main frontal tract groups compared among humans, vervets, and macaques. A–D, Images show tractography reconstructions of the frontal association (green; A), commissural (red; B), projection (blue; C), and intralobar frontal (orange; D) networks in single representative brains. Graphs show both proportional volume and absolute volume of each tract group, where data points represent individual brains (H, n = 20; V, n = 4; M, n = 5) and species mean values are indicated by horizontal lines. *p < 0.05 and ***p < 0.001 when comparing humans with either vervets or macaques. For full statistical results, see Results and Table 4.

