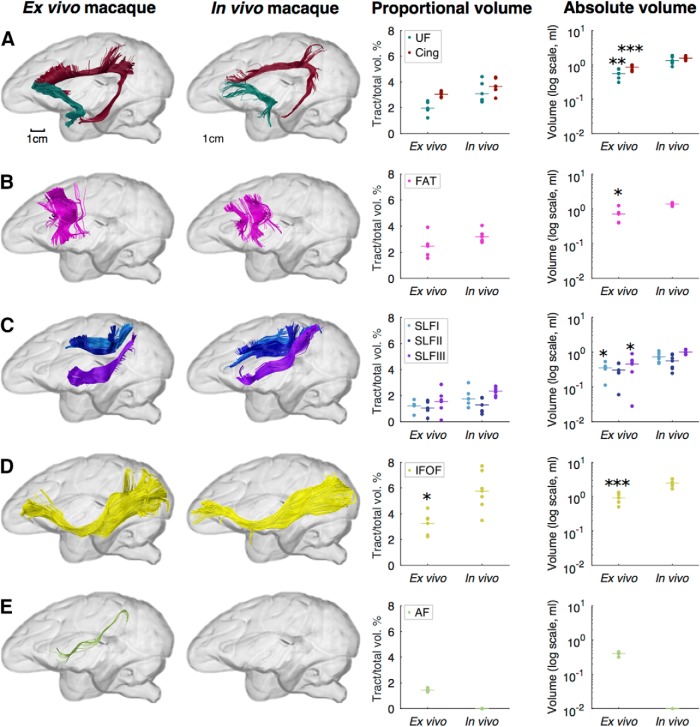
Figure 6.
Comparison of ex vivo and in vivo macaque tractography data. A–E, Images show tractography reconstructions of the cingulum (burgundy) and UF (dark green; A), FAT (pink; B), superior longitudinal fasciculus (SLF I, light blue; SLF II, dark blue; SLF III, purple; C), IFOF (yellow; D), and AF, long segment (light green; E). Data points in the graphs show proportional and absolute tract volumes for individual brains and species mean values are indicated with horizontal lines. There were no significant differences in proportional tract volume between groups, except for the inferior fronto-occipital fasciculus (Welch's F(1,6.08) = 8.34, *p = 0.027). *p < 0.05, **p < 0.01, and ***p < 0.001 when comparing ex vivo and in vivo macaques with Welch's ANOVA. The AF could not be reconstructed in the in vivo datasets. For full statistical results, see Table 6.

