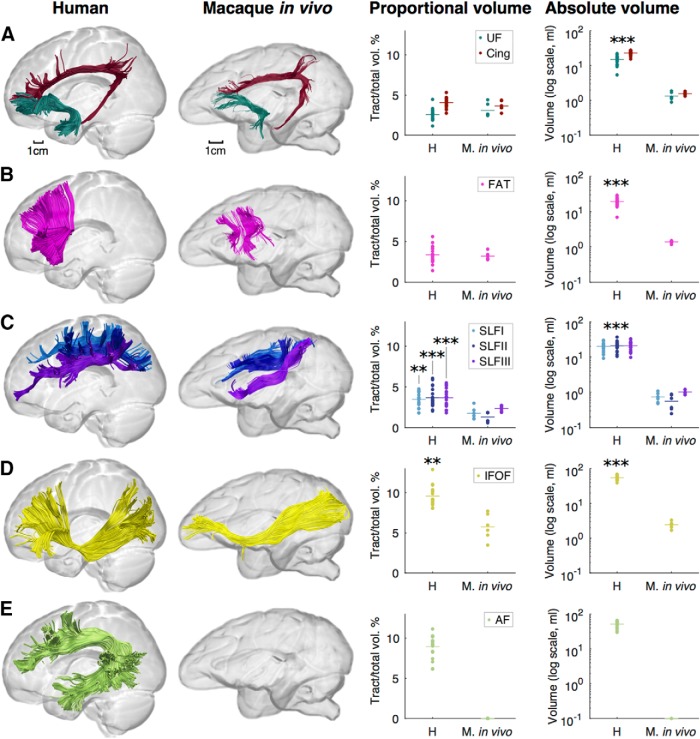
Figure 7.
Comparison of human and macaque in vivo tractography data. A–E, Images show tractography reconstructions of the cingulum (burgundy) and UF (dark green; A), FAT (pink; B), superior longitudinal fasciculus (SLF I, light blue; SLF II, dark blue; SLF III, purple; C), IFOF (yellow; D), and AF, long segment (light green; E). Graphs show proportional and absolute tract volumes for individual brains measured from the in vivo dataset for both humans and monkeys. **p < 0.01 and ***p < 0.001 when comparing humans with either vervets or macaques. Statistics were not calculated for the AF because it was not possible to reconstruct this tract in the macaque in vivo datasets. For full statistical results, see Table 6.

