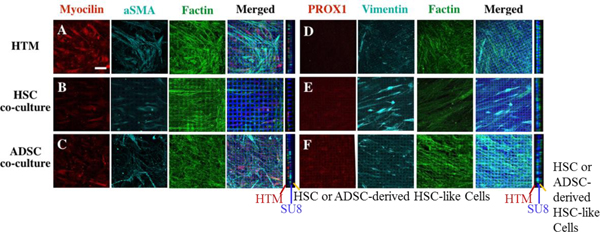
Fig. 7.

Confocal images of expression of HTM and HSC markers in HTM, HTM/HSC and HTM/ADSC- derived HSC-like constructs on SU8 scaffolds after perfusion. Expression of HTM markers myocilin and αSMA (A, B, C) and HSC marker PROX1 (D, E, F). Constructs were co-stained with F-actin (A, B, C, D, E, F) and vimentin (D, E, F) as well as DAPI to reveal nuclei, along with crossectional view in the left panel (middle blue line showed the SU8 scaffold, HTM cell on the left side of the scaffold and HSC or ADSC-derived HSC cells on the right side of the scaffold). Scale bar = 50 μm.
