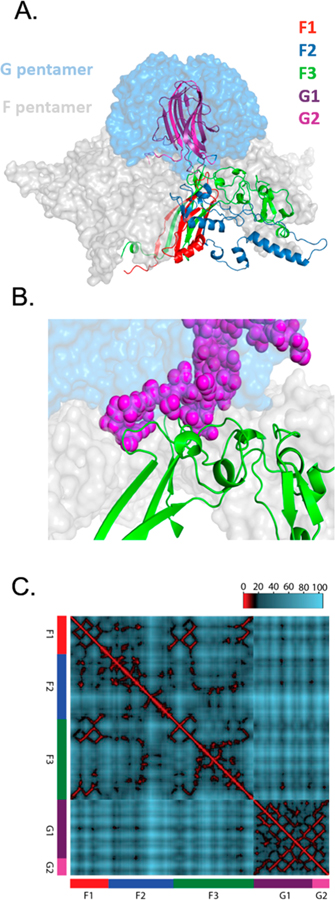
Figure 2.
Structural view of potential epistatic interactions between F and G libraries. (A) Pentameric complex between F and G shown in surface view. For both F and G, one monomer is detailed as a ribbon color-coded according to the saturation mutagenesis library prepared in this work. (B) Close-up of interaction surface between the F3 sublibrary of F protein (green ribbons) and G2 sublibrary of G protein (purple spheres). (C) Distance mapping between alpha carbons in F and G crystal structure. Residues within 10 Å are colors red, 10–20 are black, and >20 are blue. Euclidian distances calculated from F–G crystal structure. Heatmap shows that many opportunities exist for close proximity (interactions) both within and between fragments.

