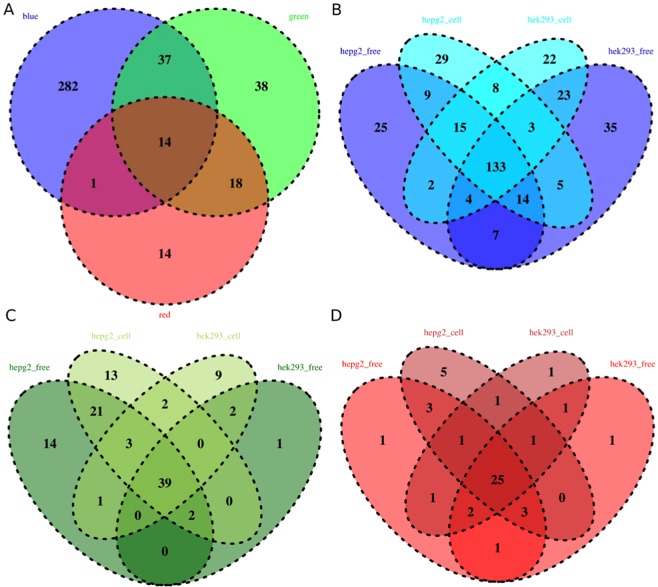
Figure 7.
Venn diagrams of active chemicals for autofluorescence assays, (A) comparing different color channels, (B) considering only the blue channel and comparing cell lines/culture conditions, (C) considering only the green channel and comparing cell lines/culture conditions, and (D) considering only the red channel and comparing cell lines/culture conditions. For specific color channels cell culture conditions are represented as cell based (hepg2_cell and hek293_cell) and cell free, culture medium only (hepg2_free and hek293_free).

