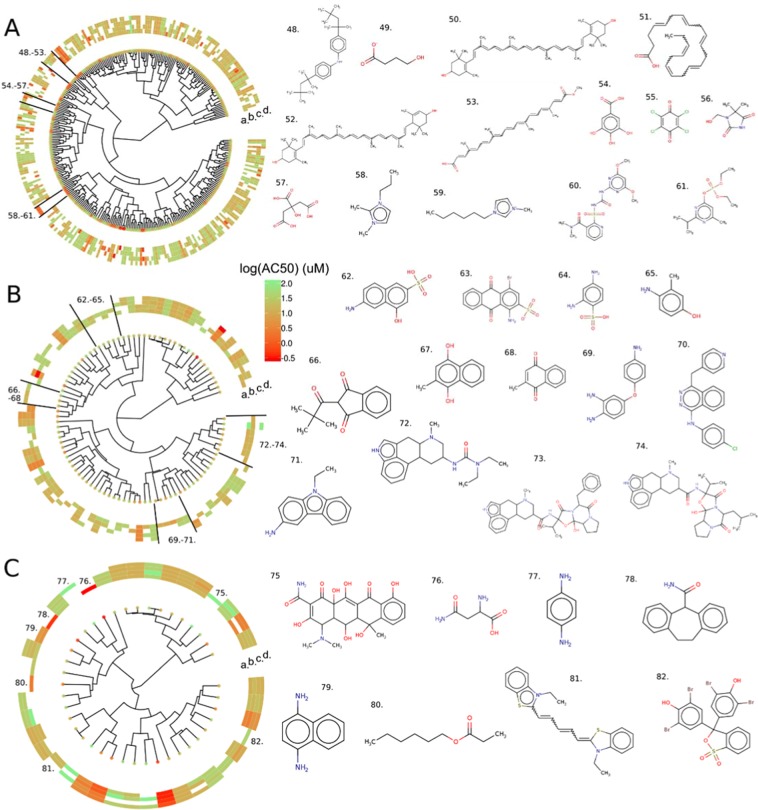
Figure 8.
Hierarchical clustering of active chemicals in autofluorescence assays for (A) blue, (B) green and (C) red channel. Hierarchical clustering is realized using a Euclidean distance computed from a set of non-redundant molecular descriptors and using Ward segregation, see methods. Potency in terms of AC50 for each chemical is represented using a color scale from red to green and for the four cell culture conditions, a. Hepg2 cell based, b. Hepg2 cell free, c. HEK-293 cell based and d. HEK-293 cell free. Some chemical structures in active chemical clusters specific to one cell culture/condition are represented; 48. 15721-78-5, 49. 508-85-2, 50. 144-68-3, 51. 6217-54-5, 52. 127-40-2, 53. 6983-79-5, 54. 149-91-7, 55. 118-75-2, 56. 118-75-2, 57. 77-92-9, 58. 218151-78-1, 59. 85100-78-3, 60. 111991-09-4, 61. 962-58-3, 62. 9-51-7, 63. 6258-06-6, 64. 88-63-1, 65. 2835-99-6, 66. 83-26-1, 67. 481-85-6, 68. 58-27-5, 69. 6264-66-0, 70. 212141-51-0, 71. 132-32-1, 72. 159701-44-7, 73. 17479-19-5, 74. 25447-66-9, 75. 6153-64-6, 76. 5794-24-1, 77. 106-50-30, 78. 7199-29-3, 79. 2243-61-0, 80. 2445-76-3, 81. 54646-38-7, 82. 115-39-9.

