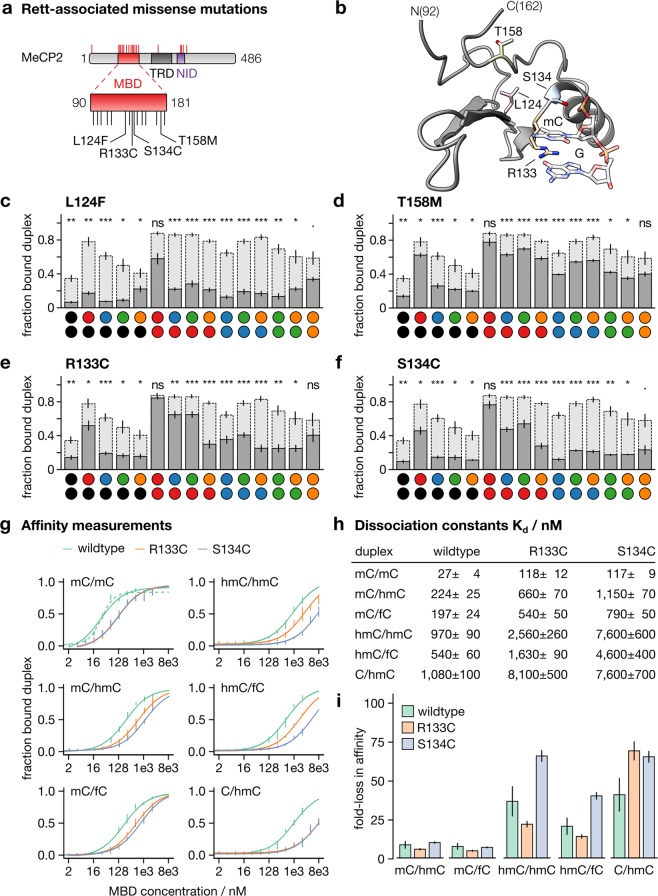
Figure 3.
Interaction of MeCP2 Rett mutants. (a) Protein architecture of MeCP2 and positions of studied mutations. (b) Rett mutations highlighted on MeCP2 in complex with mC/mC containing DNA (PDB entry 3C2I49. Prepared with UCSF ChimeraX50. (c–f) Bar diagrams of the fraction of MBD-bound DNA duplex observed in EMSA for MBDs at 1,024 nM and nucleobase combinations as indicated in dark grey; data for wildtype hMeCP2[90–181] underlaid in light gray for comparison. Data are means ± SEM from three independent experiments (see SI for full data). (g) Kd log diagrams of wildtype and Rett mutants. (h) Table of Kd values obtained from measurements in (g). (i) Fold-loss in affinity (on basis of Kd) for wildtype hMeCP2 and Rett mutants with respect to their affinity for mC/mC; mean ± SEM.

