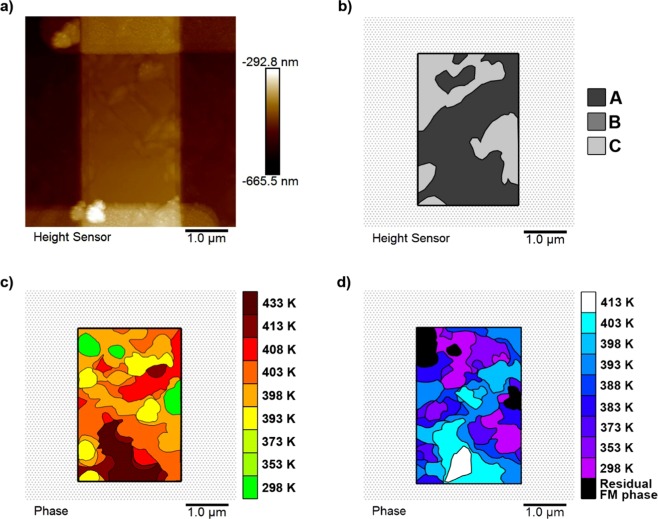
Figure 7.
The raw and extracted data from the 2 μm wide MgO(001)/Rh(1.1 nm)/FeRh(53 nm)/Pt(4.5 nm) nanowire. (a) An AFM image showing the measured height data. (b) A topography map detailing the surface structure types observed in the wire, and their locations on the wire surface. (c) Heat, and (d) cool maps showing the evolution of the FM phase throughout a temperature sweep. All data are plotted on the same scale to aid direct comparison.

