Figure 4.
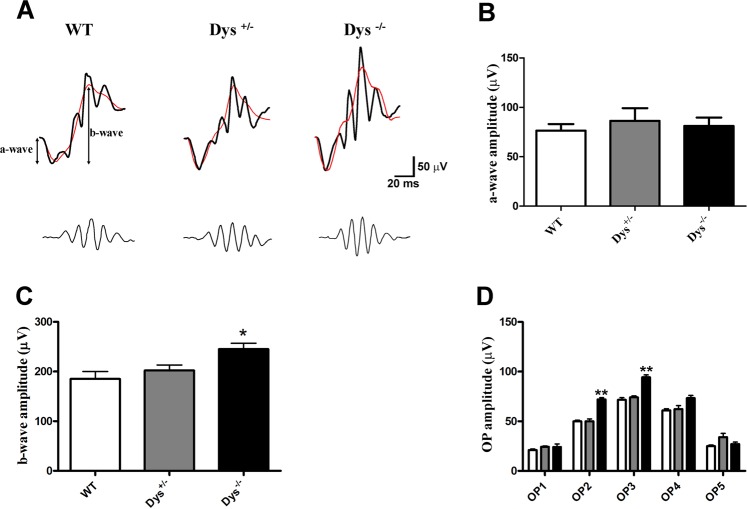
ERG records in wild type (WT), Dys+/− and Dys −/− mice. Representative ERG waveforms (top) w/o OPs (black and red lines, respectively) and representative OP waveforms (bottom) (A), a-wave amplitudes (B), b-wave amplitudes (C), and OPs amplitude (D) in WT (white bars), Dys+/− (gray bars) and Dys−/− (black bars) mice recorded at light intensity of 1 log cd-s/m2. *p < 0.05 and **p < 0.01 vs. WT. Each column represents the average ± SD (N = 12).

