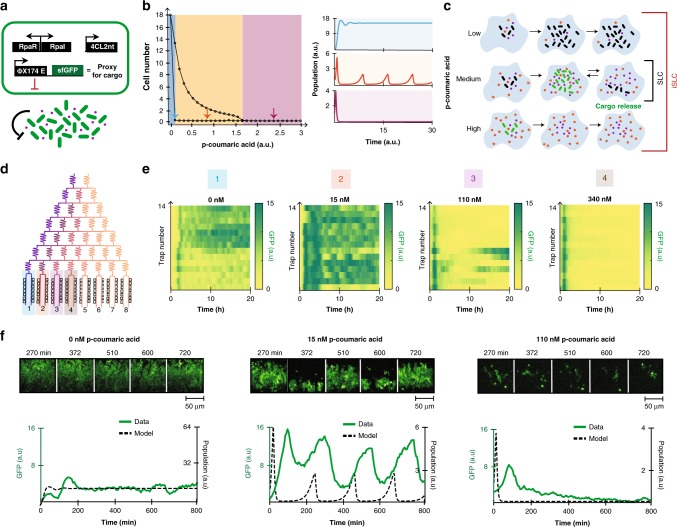
Fig. 2. Characterization of the inducible syncronized lysis circuit (iSLC).
a Genetic diagram of the iSLC strain. b Simulations of the mathematical model showing three different dynamics at low (blue), medium (orange) and high (purple) inducer values. Medium values are predicted to result in sustained oscillations. Left: steady state maximum and minimum cell population values are plotted for a range of inducer concentrations. Right: simulated time traces for three representative p-coumaric acid values predict three emergent population dynamics. c Comparison between the iSLC and SLC dynamics based upon the model simulations in part b. d Diagram of the microfluidic device used to generate the inducer gradient. e Heatmaps representing the fluorescence time traces of all 14 traps present per column of the device. GFP signal is used as a proxy for population density. Four different inducer conditions are shown: low, medium, high, extra high, respectively. f Top: representative time series images from the fluorescence channel with three different inducer concentrations: low, medium, high, respectively. Bottom: fluorescence time traces plotted together with computer simulations of the mathematical model. For the simulation (dashed lines) time units are arbitrary, therefore the correspondence is strictly qualitative. Source data are provided as a Source Data file.

