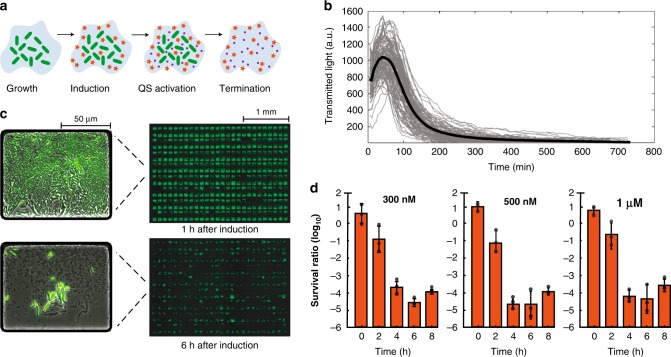
Fig. 3. Characterization of the iSLC kill switch properties in microfluidics and liquid culture.
a Illustrated iSLC strain kill switch mechanism. b Example time traces (n = 104) extracted from the transmitted light channel (gray). Solid black line represent the mean. At time zero the cells were induced with 500 nM p-coumaric acid. c Movie stills (4x) of the microfluidic chip before (top) and 6 h after (bottom) induction with 500 nM p-coumaric acid. Left side shows magnified images (x30) of a single representative trap. d Cell viability measured by CFU count following addition of the killing signal (p-coumaric acid) in liquid culture. Individual data points are represented by circles, the bars represent mean ± standard deviation of the three independent replicates. Source data are provided as a Source Data file.

