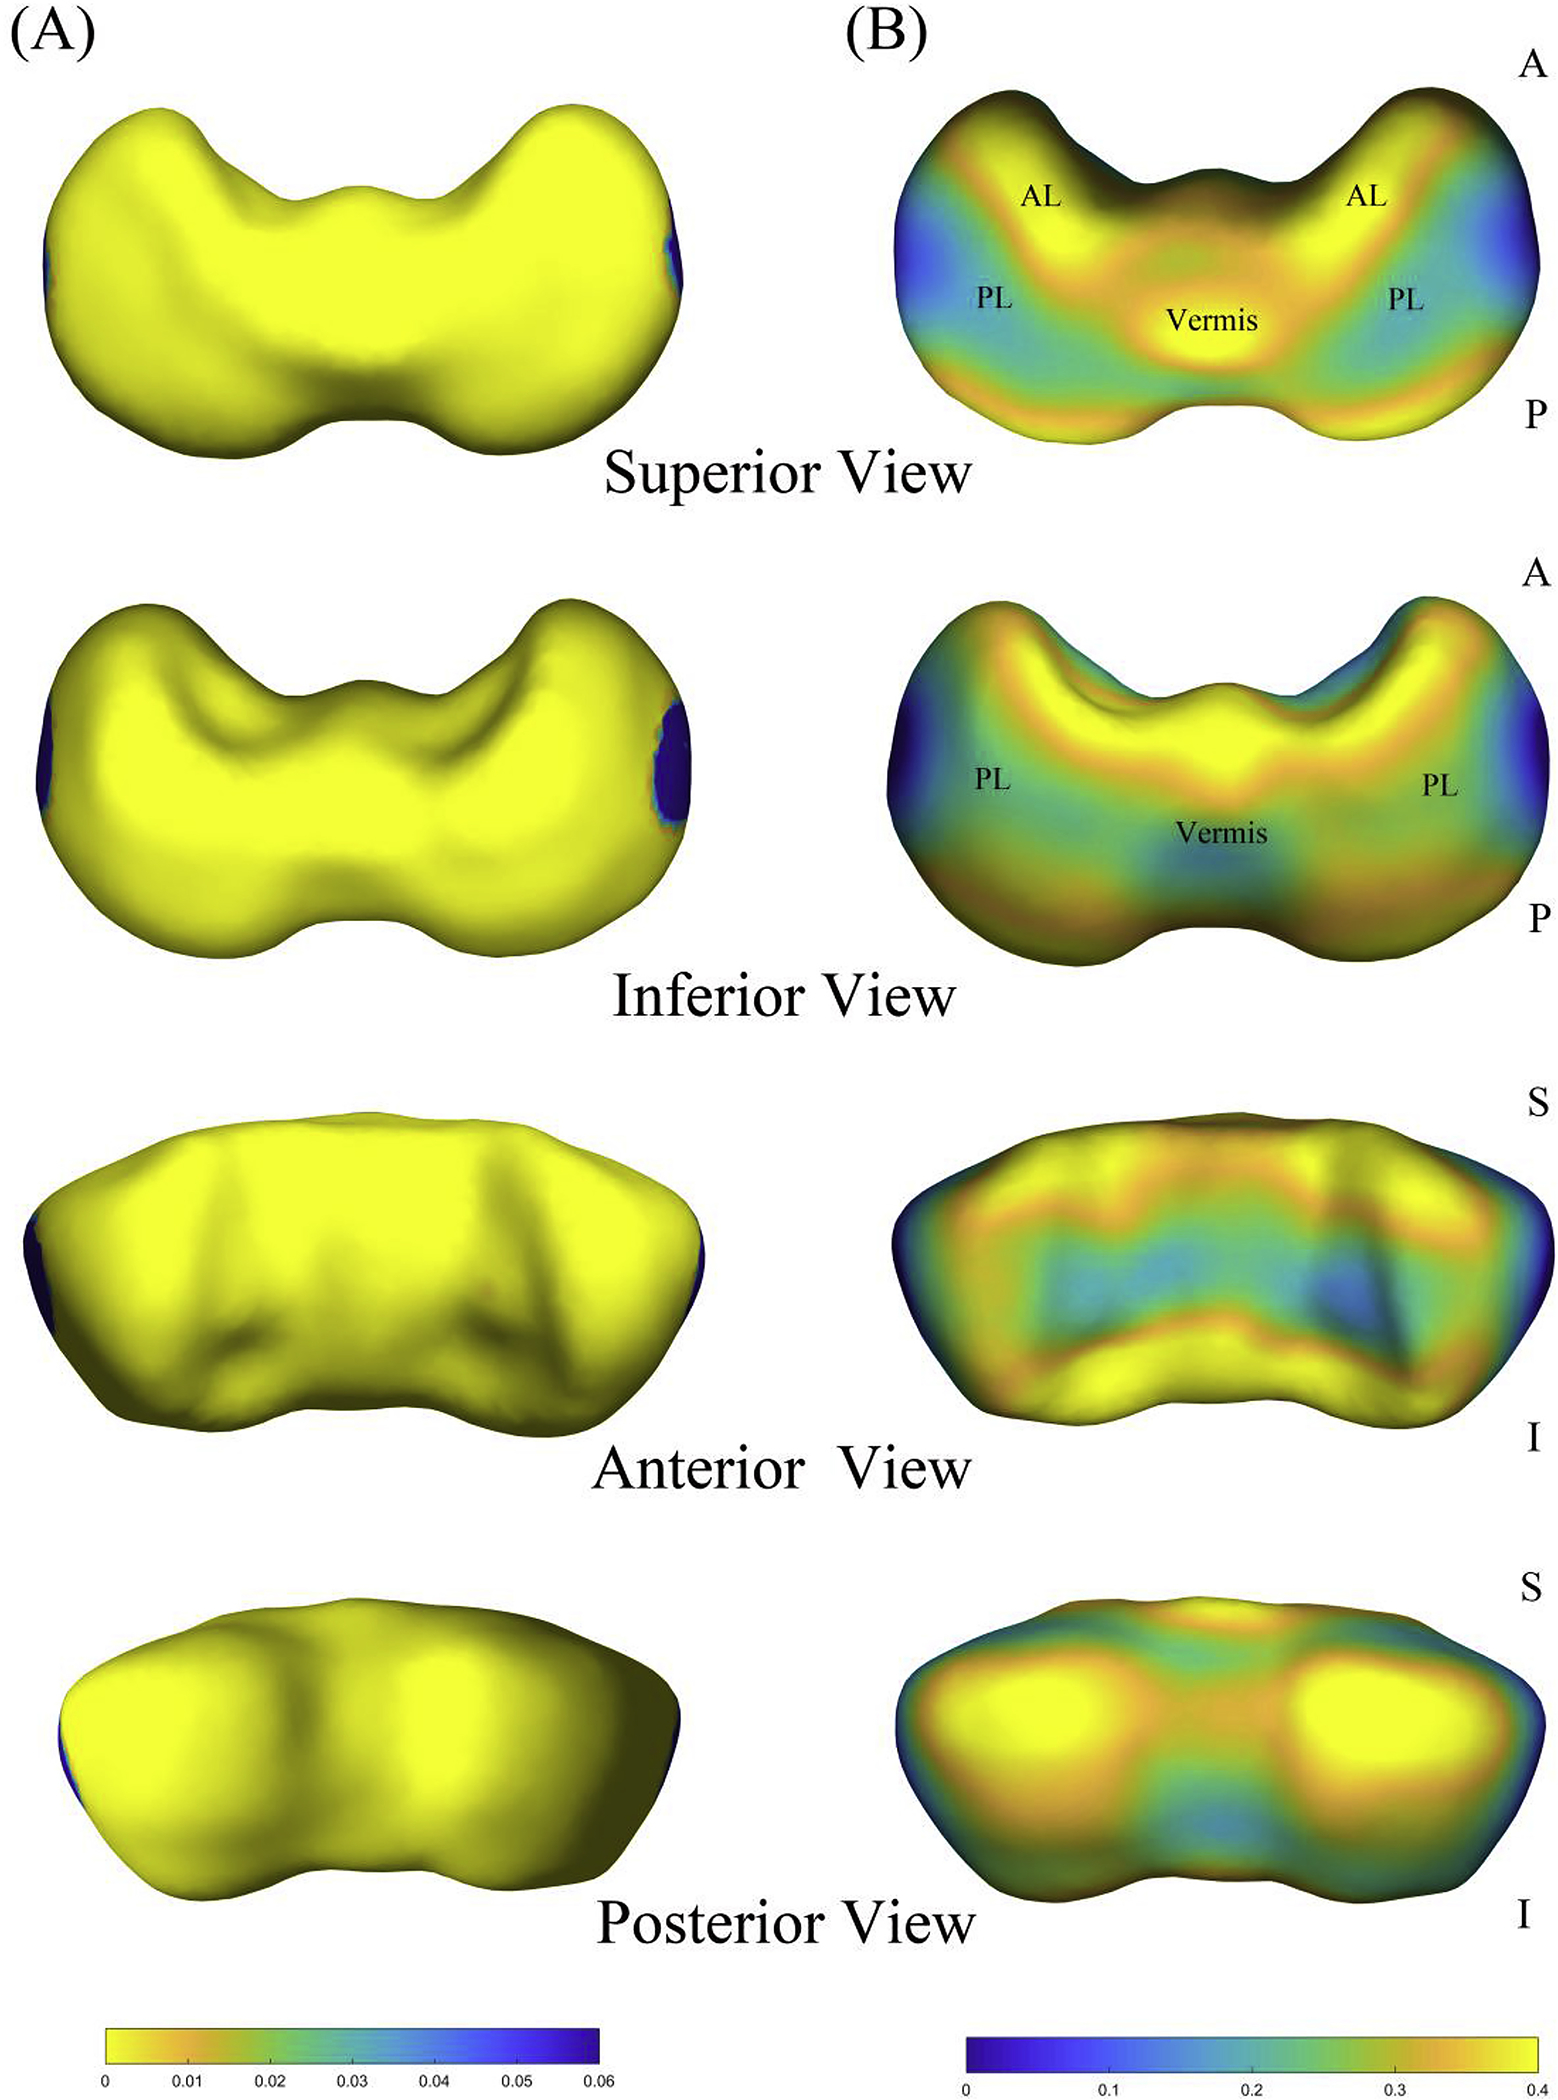
Fig. 4.

Shape analysis results of the cerebellar surface. (A) P-value map is overlaid on the template of the cerebellum. (B) Regression coefficient map of the shape statistics. Superior, inferior, anterior, and posterior views are shown. Abbreviations: (AL) anterior lobe; (PL) posterior lobe.
