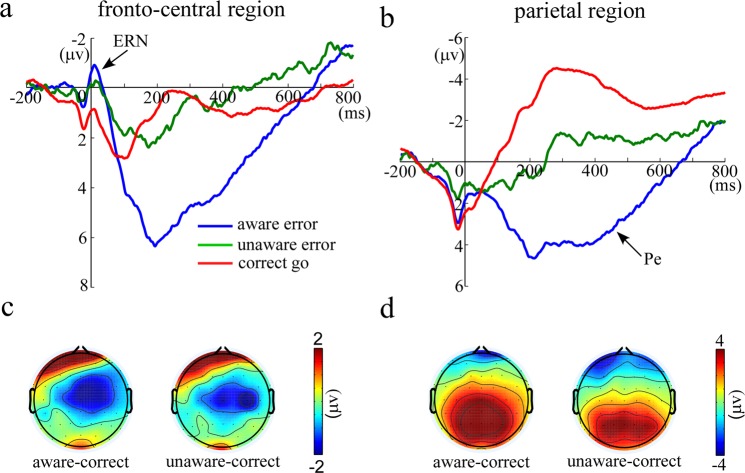
Figure 2.
The ERN and Pe results in the present study. Panel a shows the response-locked grand-averaged ERP waveforms for the ERN (−20 to 50 ms) in the fronto-central region [(FCz + FC1 + FC2 + Cz + C1 + C2)/6]. Panel b shows the response-locked grand-averaged ERP waveforms for the Pe (150 to 500 ms) in the parietal region [(CPz + CP1 + CP2 + Pz + P1 + P2)/6]. Data were filtered offline with a passband 0.1–30 Hz. Blue line indicates the neural activity of aware errors, green line indicates the neural activity of unaware errors, and red line indicates the neural activity of correct go trials. Panels c shows the difference topography distribution of ERN between aware errors and correct go trials and the difference topography distribution of ERN between unaware errors and correct go trials, respectively. Panel d shows the difference topography distribution of Pe between aware errors and correct go trials and the difference topography distribution of Pe between unaware errors and correct go trials, respectively.

