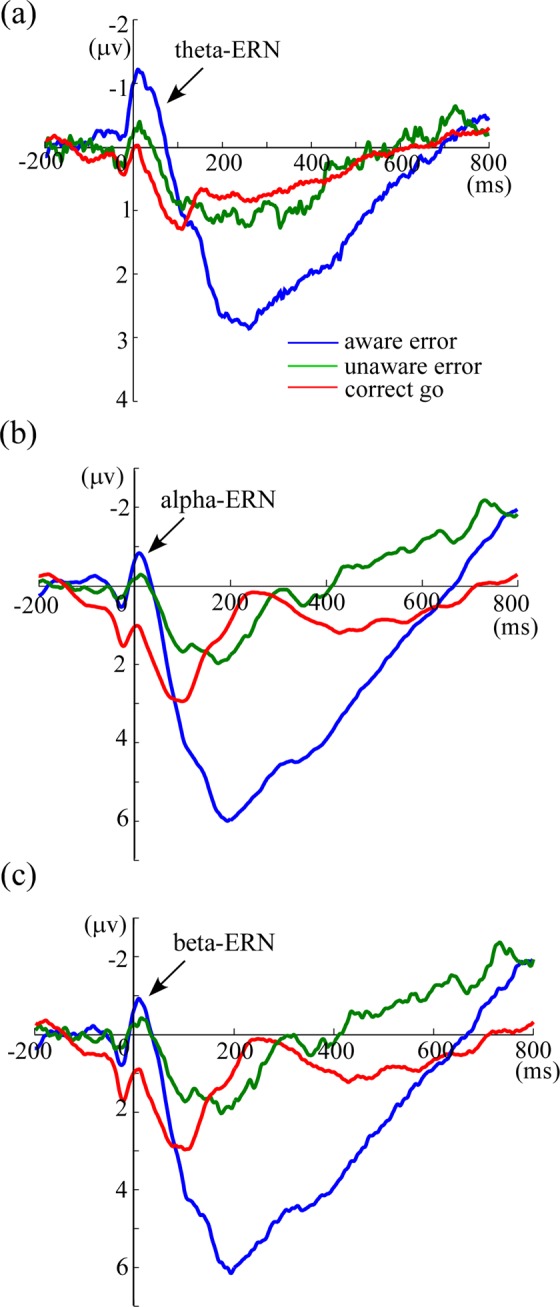
Figure 3.

The ERN results in the theta, alpha and beta frequency bands, respectively. Panel a shows theta-ERN results, indicating that theta-ERN is significantly larger for aware compared with unaware errors. Panels b and c show alpha-ERN and beta-ERN results, indicating that alpha-ERN and beta-ERN are both not difference between aware and unaware errors. Blue line indicates the neural activity of aware errors, green line indicates the neural activity of unaware errors, and red line indicates the neural activity of correct go trials.
