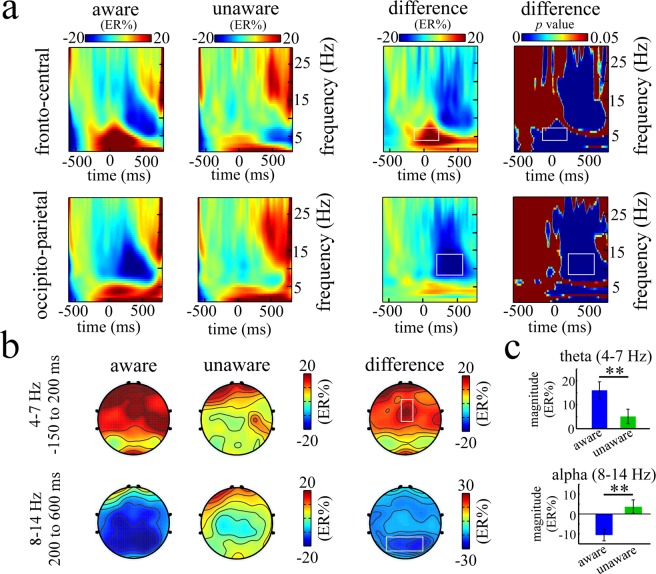
Figure 4.
The time-frequency results for aware and unaware errors during the response period. Panel a shows the grand-average time-frequency representations (expressed as ER%) for aware and unaware errors and the difference time-frequency representations (aware errors minus unaware errors) within the defined S-ROIs, including fronto-central region [(Fz + FCz + Cz)/3] and occipito-parietal region [(Pz + P3 + P4 + POz + PO3 + PO4)/6]. The corresponding difference p map is the result of bootstrapping statistical analysis at the significance level of p < 0.05 (FDR corrected), which is used to define the TF-ROI in each S-ROI. Note that a pre-response interval from −600 to −100 ms is used as the baseline. The time-frequency pixels displaying a significant difference from the baseline are colored in blue. The significant task-related TF-ROIs are outlined in the rectangles. Each row corresponds to one S-ROI corresponding to the largest modulation of the task-related effects. X-axis, time (ms); Y-axis, frequency (Hz). Panel b shows the scalp topographies of ERSP magnitudes for aware and unaware errors and the difference topographies (aware errors minus unaware errors) within the defined TF-ROIs (theta band: 4–7 Hz, −150 to 200 ms; alpha band: 8–14 Hz, 200 to 600 ms). The significant task-related S-ROIs are outlined in the white rectangles. Panel c shows mean ERSP magnitudes (expressed as ER%) for aware and unaware errors in the theta and alpha bands, respectively.

