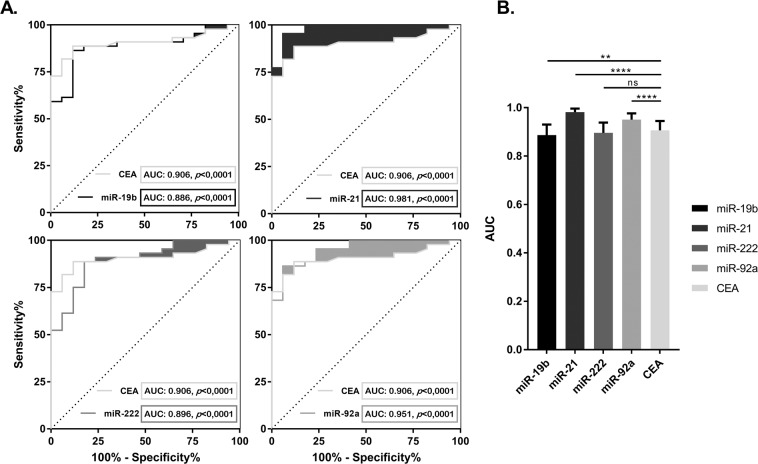
Figure 4.
ROC curves and AUC of EV-miRNA expression in mCRC identification: (A) Receiver Operating Characteristics (ROC) curves and AUC of baseline EVs miR-19b, 21, 222, 92a and CEA, adjusted by age and gender, according to metastatic colorectal cancer (mCRC) identification. Shaded areas show the increased sensitivity and specificity of each miRNA vs. the CEA curve. (B) Histogram representing the AUC of each miRNA and their statistical differences with baseline CEA. miR-21 and miR-92 were the best predictors in the identification of mCRC with higher sensitivity and specificity than baseline CEA, while miR-222 showed no statistical differences and 19b had lower sensitivity and specificity than CEA. Data are presented as histogram of the mean with the standard error bars. *p < 0.05, **p < 0.01, ***p < 0.001, ****p < 0.0001, ns: no significant differences.

