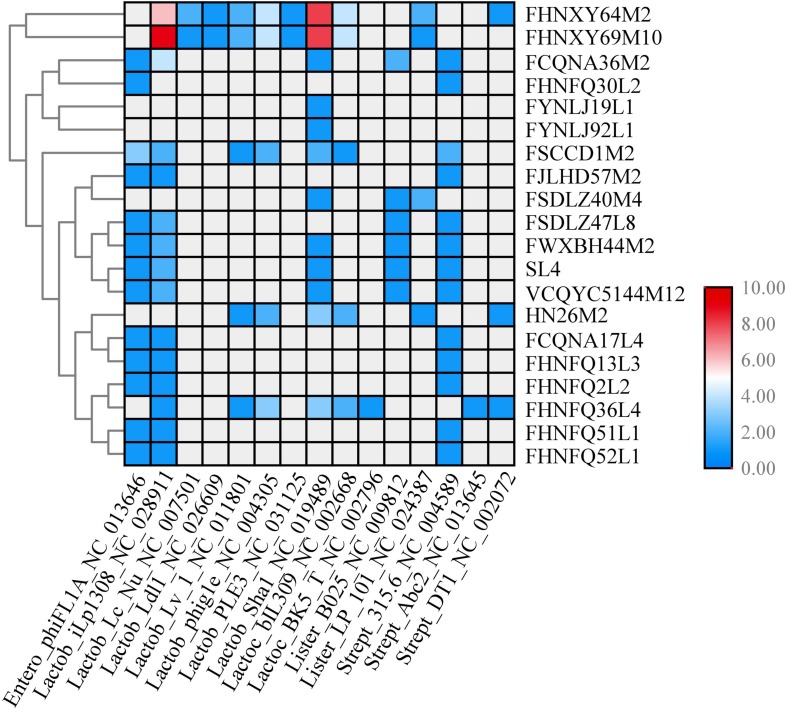
FIGURE 14.
CRISPR spacers targeting prophages in P. pentosaceus genomes. The heatmap represents P. pentosaceus CRISPR spacers that matched prophages in P. pentosaceus. The vertical axis represents the genomes that harbor prophages targeted by P. pentosaceus CRISPR spacers. The horizontal axis represents P. pentosaceus strains carrying CRISPR spacers that target prophages. The color scales represent the number of targeting events with gray squares represents the absent of matches and red squares representing the highest number of targeting.

