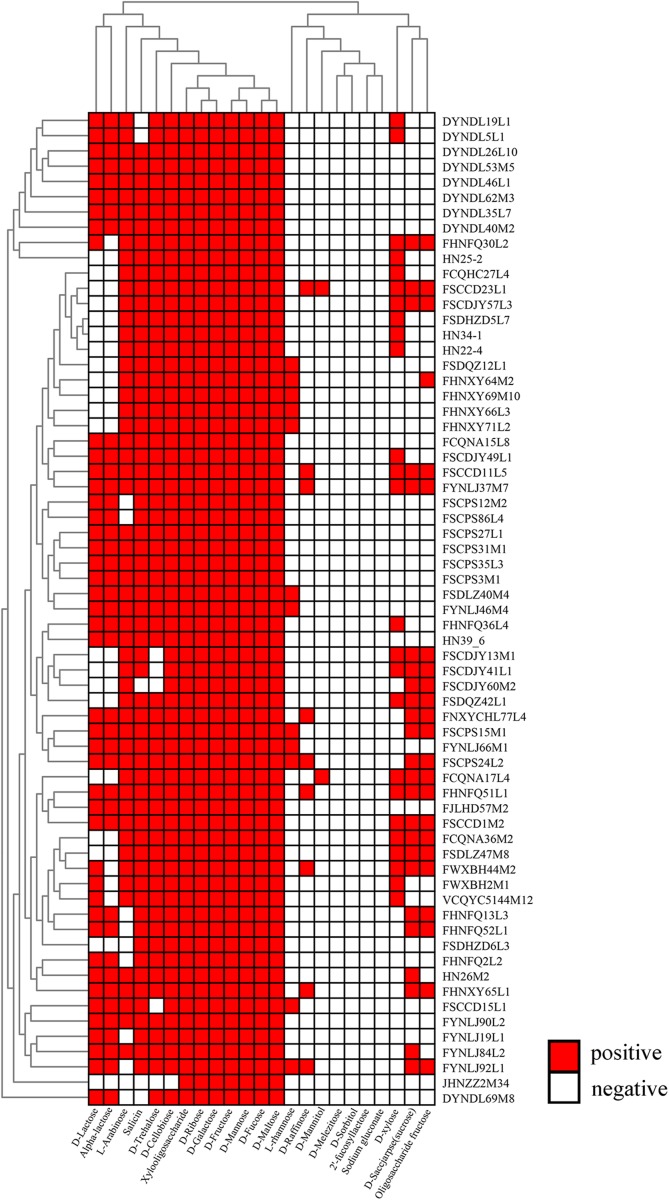
FIGURE 8.
Evaluation of carbohydrate utilization by P. pentosaceus strains. Heatmap showing the growth performance of P. pentosaceus strains on different carbon sources at 24 h. The vertical axis represents the genomes tested in this study which were clustered according to the phylogenetic tree. The horizontal axis represents 23 carbohydrates used in this test. The color scales represent the degree of P. pentosaceus utilizing carbohydrates with white squares (as in blank) represents the inability of strains to metabolize the corresponding sugar and red squares representing the ability of strains to metabolize the corresponding sugar.

