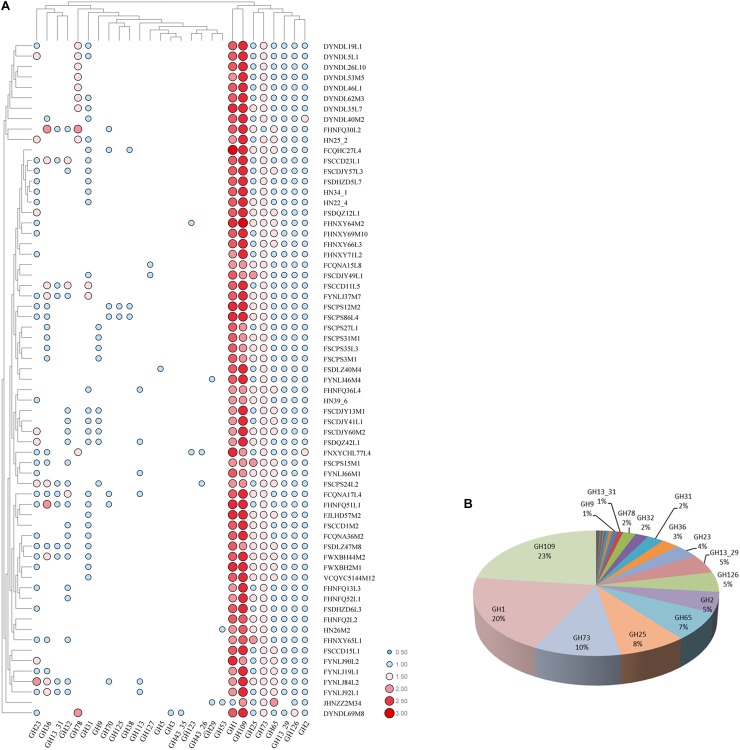
FIGURE 9.
GH families identified in P. pentosaceus. (A) Heatmap showing the distribution of GH families in 65 P. pentosaceus (The number of GH families was log scaled). The vertical axis represents the genomes that harbor GH families which was clustered according to the phylogenetic tree. The horizontal axis represents GH families predicted in P. pentosaceus. The color scales represent the number of GH families existed in each genome with white dot (as in blank) represents the absent of matches and red squares representing the highest number of GH families. (B) Pie chart indicating the percentage of each GH family identified in P. pentosaceus genomes.

