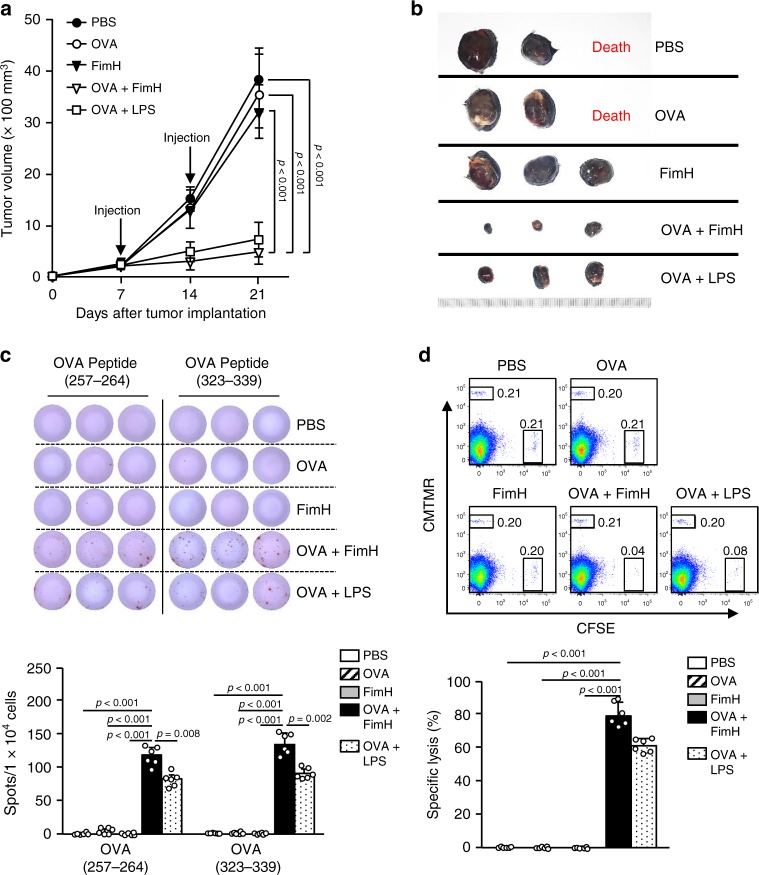
Fig. 4. Combined OVA and FimH treatment inhibits B16-OVA tumor growth.
C57BL/6 mice were injected s.c. with 1 × 10⁶ B16-OVA cells on the right side. After 7 and 14 of tumor-cell injection, the mice received s.c., 2.5 mg per kg of OVA, 2.5 mg per kg of FimH, or a combination of OVA and FimH in PBS. a The B16-OVA tumor growth curves are shown. (n = 6 mice, significance determined by the log-rank test, mean ± SEM. b Representative tumor masses on day 21 are shown. (n = 6 mice). c OVA peptides (257–264) and (323–339) specific IFN-γ production in iLN cells were measured by ELISpot analysis (upper panel). The mean numbers of spots are shown (lower panel). (n = 6 mice, one-way ANOVA, mean ± SEM). d Ag-specific cytotoxic activity was measured in the mouse in vivo. Dot plots showed the percentages of SIINFEK-loaded CFSE+ cells and CMTMR+ cells not loaded with peptide (upper panel). The mean percentages of Ag-specific lysis are shown (lower panel). (n = 6 mice, one-way ANOVA, mean ± SEM).

