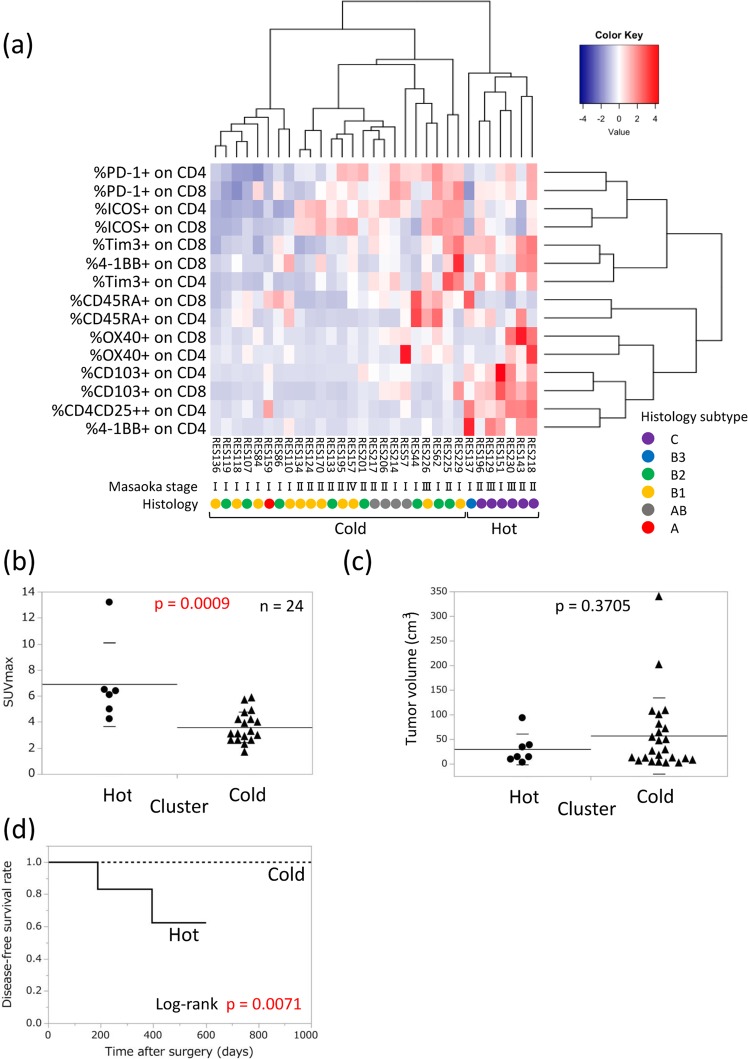
Figure 1.
T-cell profiling in TETs. (a) Clustering analysis for the T-cell profiling of TETs (n = 31). The T-cell parameters of CD4 and CD8 single-positive T cells measured by flow cytometry are listed. Clinical information shows the pathological WHO histological classification and Masaoka stage. The SUVmax (n = 24) of FDG-PET/CT (b) and tumor volumes (c) were compared between hot and cold clusters. Tumor volumes were calculated by the following formula: tumor volume (cm3) = length × width × thickness/2. Measurements were performed using surgically resected specimens. Means with SD were shown. (d) Disease-free survival curve of patients in the hot and cold clusters.

