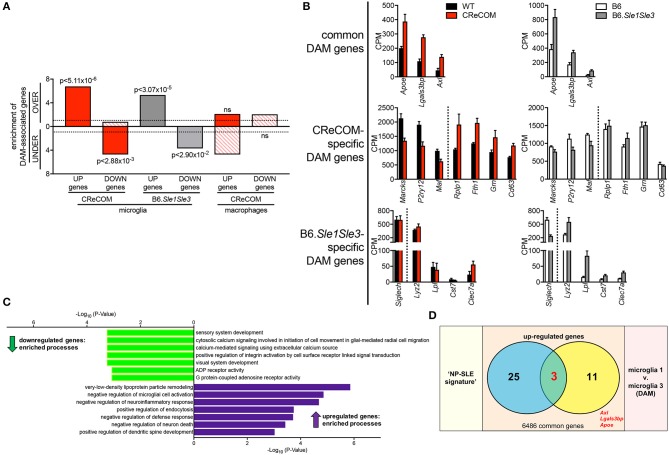
Figure 6.
Expression of DAM-associated genes in NP-SLE microglia. FACS-purified microglia of 11-12-month-old female WT (n = 4), and CReCOM (n = 4) mice were analyzed by RNA-seq and compared to data from 8-10-month-old female B6 and B6.Sle1Sle3 mice (17). Differential genes (DESeq2, p < 0.05, fold change>1.5) in CReCOM (581) and B6.Sle1Sle3 (472) microglia compared to their respective controls were determined. Differential genes (fold change in average UMI count>1.5) between Microglia3 (DAM) and Microglia1 populations (48) were determined (29). (A) Enrichment of significantly upregulated (UP) and downregulated (DOWN) genes in microglia or macrophages from NP-SLE models in the over-(OVER) or under-(UNDER)-expressed genes in DAMs. Enrichment=ratio of the observed number of genes that overlap DAM-associated genes divided by the expected number. Dotted line at enrichment value of “1” denotes observed number equals expected number of overlapping genes due to chance. P-values reflect hypergeometric distribution. (B) Expression values (CPM) for shared genes in microglia from NP-SLE-like disease models and DAM, termed “DAM signature.” (C) GO processes associated with 15-gene “DAM signature.” (D) Overlapping genes between upregulated genes in “NP-SLE” and “DAM” signatures (p < 2.70 × 10⁻⁷, hypergeometric distribution).

