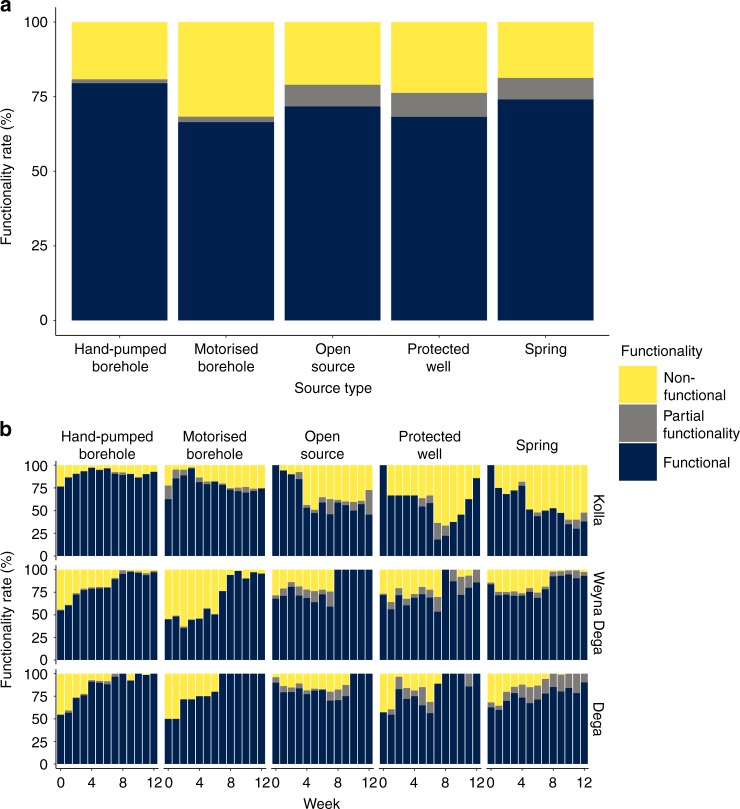
Fig. 3. Water source functionality.
a Overall functionality of each water source type during the drought. Supplementary Figure 2 shows the number of site visits and for which functionality data are available. b Weekly functionality rates of each water source type in the Ethiopia’s three altitude zones. Supplementary Figure 5 provides details on the numbers of each source type visited in each altitude zone and for which functionality data are available.

