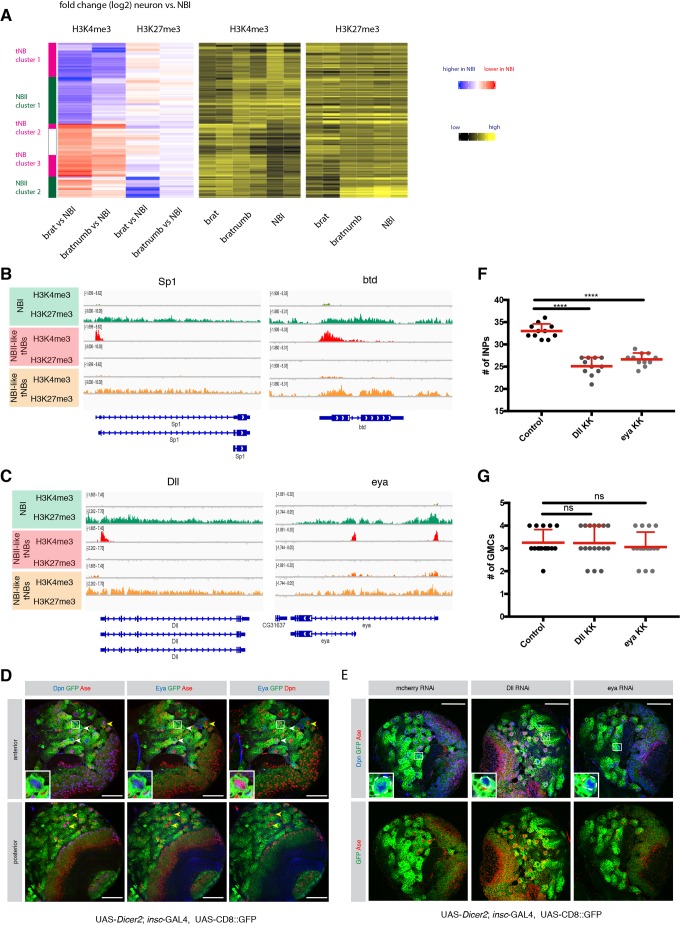
Fig. 3.
Comparison of different NB subtypes identifies PcG and TrxG-dependent NBII-specific factors. (A) Unsupervised hierarchical clustering analysis of gene log2 fold change between NBI, NBI-like tNB and NBII-like tNB (relevant section is shown, for full heatmap see Fig. S2). (B,C) ChIP-seq tracks of the known NBII factors Sp1 and btd (B) and novel NBII-specific factors Dll and eya (C). (D) Eya immunostaining in type I and type II neuroblasts. Driver line used was UAS-dicer2; insc-Gal4, UAS-CD8::GFP. White arrowheads show NBIIs, yellow arrowheads show NBIs. Inset shows magnification of boxed area, showing a close-up of NBIIs. (E) Immunostainings of larval brains expressing RNAi against Dll or eya show smaller NBIIs. Inset shows magnification of boxed area; NBIIs are circled with white dashed line. (F,G) Quantification of immediate progenies of NBIIs (F) and NBIs (G). The driver line used was UAS-dicer2; insc-Gal4, UAS-CD8::GFP. Data are mean+s.d. For INPs (F): control, 33±1.61; Dll, 25.09±1.97; eya, 26.64±1.43; n=11. For GMCs (G): control, 3.25±0.57 (n=16); Dll, 3.23±0.75 (n=17); eya, 3.05±0.65 (n=17). ****P<0.0001 (one-way ANOVA test). ns, not significant. n numbers are lineages quantified. Scale bars: 50 µm.

