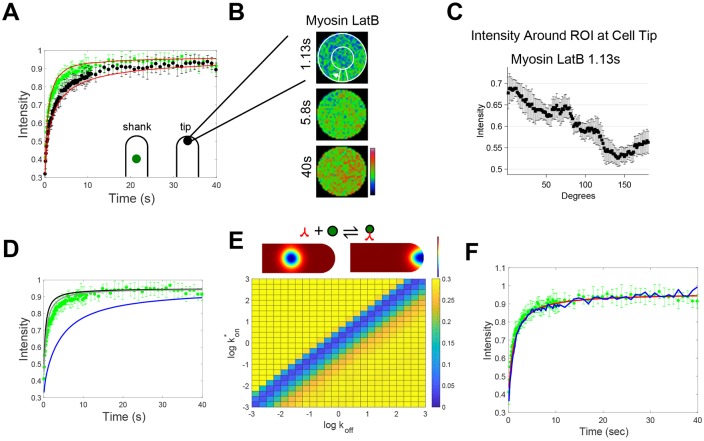
Fig. 2.
Treatment with latrunculin B allows to characterize binding between myosin XIa and vesicles. (A) Fluorescence recovery of 3mEGFP-myosin XIa at the shank (green circles) and the tip (black circles) in cells treated with latrunculin B. Red lines indicate the reaction diffusion FRAP model with best-fit dissociation constant (Kd), and a diffusion coefficient for myosin XI for its closed configuration (D=3.4 μm2/s). n=6 and 8 cells for the shank and tip, respectively. Fluorescence intensity from tip and shank regions was normalized to the pre-bleach fluorescence intensity of the shank region. Error bars ±s.d. (B) Cropped and frame-averaged photobleached ROI at the cell tip for cells expressing 3mEGFP-myosin XIa and treated with latrunculin B. White circles and arrow indicate how the perimeter of the ROI was measured during the recovery. (C) Fluorescence intensity profile of 3mEGFP-myosin XIa along the perimeter of the ROI at 1.13 s after photobleaching. (D) Fluorescence recovery of 3mEGFP-myosin XIa in cells treated with latrunculin B at the shank (green circles) compared to theoretical myosin XIa diffusion, where D=2.3 (gray line), 3.4 (black line) or 0.29 μm2/s (blue line). (E) Example reaction–diffusion model of FRAP at the cell shank and tip at 1.13 s after photobleaching (top). Red indicates concentrated pixels and blue indicates less concentrated pixels. kon and koff heat map of the sum of squared differences between the Comsol reaction–diffusion model at the cell shank and the experimental myosin XIa fluorescence recovery at the shank (bottom). Bright yellow indicates large differences and dark blue indicates small differences. (F) Fluorescence recovery of 3mEGFP-myosin XIa in cells treated with latrunculin B at the shank (green circles) and corresponding two-dimensional infinite-boundary reaction–diffusion model as described by Kang et al. (2010) (red line). Blue line indicates the fluorescence recovery from Digital Confocal Microscopy Suite. Both simulations were run by using: U/B = 0.5.

