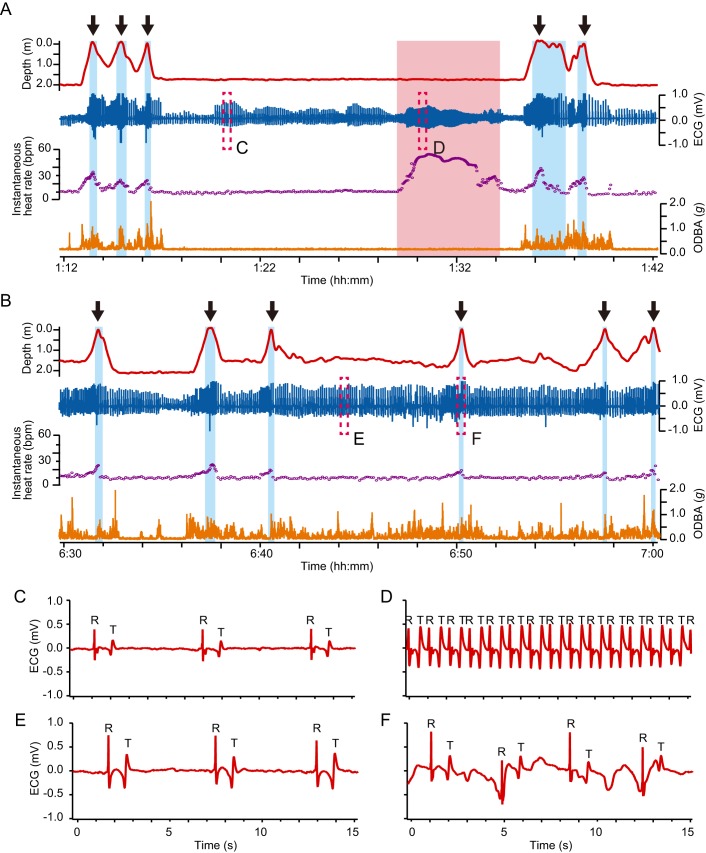
Fig. 1.
Typical examples of ECG traces and cardiac responses during resting and active dives in a green turtle (CM5). Typical profiles of depth, ECG, instantaneous heart rate and ODBA in (A) resting and (B) active dives. Blue and red backgrounds represent surface periods and extreme tachycardia periods, respectively. Black arrows represent breathing events. The ODBA values were calculated at each sampling interval of 3-axis acceleration (16 Hz or 20 Hz). Instantaneous heart rate was calculated from the intervals between consecutive R peaks. (C–F) Enlarged views of the ECG enclosed by dashed boxes in A and B. Typical ECG traces (C) in resting state, (D) during extreme tachycardia, (E) while swimming and (F) at surface ventilation. ‘R’ and ‘T’ labeled in these figures indicate the points of R peaks and T waves, respectively.

