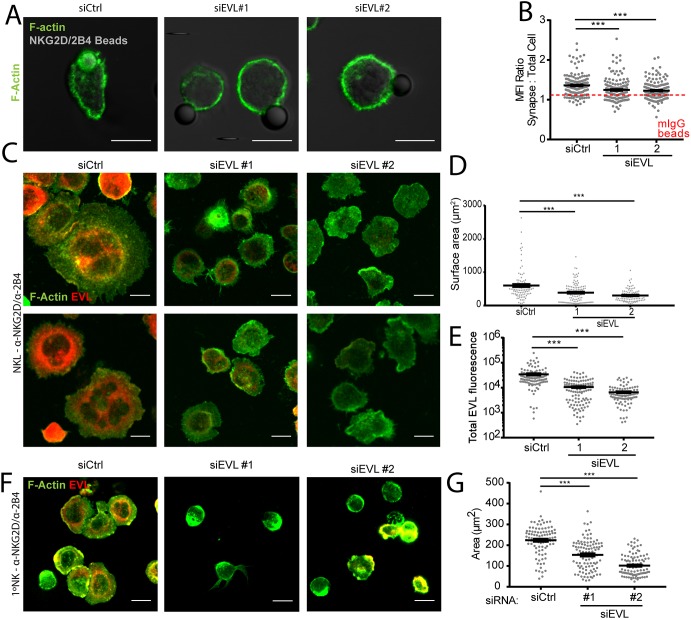
Fig. 4.
NK cell activating receptor-driven localized actin accumulation is dependent on EVL. (A) EVL (siEVL #1 or #2) or a control siRNA (siCtrl)-treated NKL cells were allowed to adhere to anti-NKG2D/2B4-coated latex beads and then fixed and imaged for the presence of F-actin via phalloidin staining. (B) Results from three independent experiments are quantified in comparison to the same cell groups conjugated with mIgG-coated beads as a negative control for F-actin accumulation (demarcated by dotted red line with full data in Fig. S3A,B). (C–E) NKL cells nucleofected with control siRNA or siEVL were allowed to adhere to anti-NKG2D/2B4-coated coverslips for 15 min, and then were fixed and imaged for the localization of EVL and F-actin via phalloidin staining (C). The surface area of the cell at the coverslip from three independent experiments interface is quantified in D and the amount of total EVL fluorescence for one representative experiment is quantified in E. (F,G) Primary NK cells nucleofected with control siRNA or siRNA targeting EVL were allowed to spread for 15 min on anti-NKG2D/2B4-coated coverslips, then fixed and imaged at the plane of the cell–coverslip interface (F). A representative quantification of a single experiment is shown in G and represents three independent experiments with independent NK cell donors. All data is representative of a minimum of three independent experiments. Error bars indicate s.e.m. from the indicated mean. ***P<0.0005 (Student's t-test). Scale bars: 10 µm.

